Showing posts with label U.S.. Show all posts

Wednesday, June 3, 2009

U.S.'s $160 Billion INFRA Status + Roundtable

According to Bloomberg, of the $162 Billion dollars of INFRASTRUCTURE aid the U.S. federal government pledged to spend in February as part of its unprecedented $787 Billion Economic STIMULUS package, only about $50 Billion, or 31%, has been paid out thus far. As a result, it can be reasonably concluded that most global infrastructure/industrial companies that stand likely to benefit from the massive U.S. stimulus program (Examples include: CAT/Caterpillar, GE/General Electric, DE/Deere, FWLT/Foster Wheeler, FLR/Fluor, UTX/United Technologies, ETN/Eaton, JEC/Jacobs Engineering, SGR/Shaw Group, MDR/McDermott, HON/Honeywell, TEX/Terex, etc.), will not see the desired effects on their respective companies' balance sheets until towards the end of 2009/beginning of 2010.

Somewhat related, the uber powerful and equally innovative CEOs of both Caterpillar (CAT) and Google (GOOG) appeared on MSNBC's Meet The Press program on Sunday, May 31st, 2009. During the engrossing CEO roundtable discussion hosted by David Gregory (the clip is included below), both rock star executives shared their insightful assessments of the current state and future direction of the U.S. economy. I found it particularly interesting to listen to Jim Owens' take since he leads the operations of a company very much at the manufacturing heart of the U.S. economy. Among Mr. Owens' more interesting comments, the CEO of Caterpillar expects the global economy to BOTTOM sometime during the 3rd quarter of 2009. He also, perhaps somewhat tellingly, doesn't expect his company to resume hiring until mid 2010.


http://bloomberg.com/apps/news?pid=20601109&sid=aUfrUQkdTg1s


Data Courtesy: Bloomberg and MSNBC
Full Disclosure: I own shares of GOOG, CAT, DE and GE.

Sunday, May 24, 2009

Most/Least Affordable Cities 2 Buy A HOME

According to the results of a recent nationwide industry analysis of housing markets compiled by Wells Fargo (WFC) and the National Association of Homebuilders, below are Lists of the Top 10 Most and Least Affordable large U.S. Cities to purchase a home. Per the study, large U.S. cities under consideration referred to only those cities with populations larger than 500,000 citizens. Also worth noting, and per the below link, in terms of the calculated 'affordability index' metric, "...To be deemed affordable, a family making the median national income of $64,000 must be able to buy the property and devote no more than 28% of their income toward housing costs."


Top 10 MOST Affordable U.S. Cities:
(Rank -- City -- Affordability Index -- Median Home Price)
1. Indianapolis, Indiana -- 94.8 -- $98,000
2. Youngstown, Ohio -- 94.4 -- $67,000
3. Akron, Ohio -- 93 -- $78,000
4. Grand Rapids, Michigan -- 91.8 -- $97,000
5. Syracuse, New York -- 91.3 -- $85,000
6. Warren, Michigan -- 91.2 -- $119,000
7. Cleveland, Ohio -- 91 -- $86,000
8. Buffalo, New York -- 90.4 -- $90,000
9. Toledo, Ohio -- 90.2 -- $78,000
10. Dayton, Ohio -- 90 -- $85,000


Top 10 LEAST Affordable U.S. Cities:
(Rank -- City -- Affordability Index -- Median Home Price)
1. New York, New York -- 21.5 -- $418,000
2. San Francisco, California -- 32.1 -- $525,000
3. Los Angeles, California -- 42.1 -- $288,000
4. Nassau-Suffolk, New York -- 43 -- $375,000
5. Honolulu, Hawaii -- 44.1 -- $360,000
6. Santa Ana, California -- 48.2 -- $360,000
7. Newark, New Jersey -- 49.3 -- $315,000
8. Miami, Florida -- 49.6 -- $185,000
9. McAllen, Texas -- 50.3 -- $160,000
10. El Paso, Texas -- 52.9 -- $127,000


realestate.yahoo.com/homes-most-affordable-in-2-decades


Data Courtesy: Yahoo Real Estate, NAHB and Wells Fargo

Wednesday, May 13, 2009

OECD's Top 10 Highest CORPORATE Tax Rates

1. Japan --- 39.54%

2. United States --- 39.25%

3. France - 34.42%

4. Belgium --- 33.99%

5. Canada --- 33.5%


6. Luxembourg --- 30.38%

7. Germany --- 30.18%


8. New Zealand --- 30%

8. Spain --- 30%

8. Australia --- 30%


* OECD's 30 member countries: Australia, Austria, Belgium, Canada, Czech Republic, Denmark, Finland, France, Germany, Greece, Hungary, Iceland, Ireland, Italy, Japan, Luxembourg, Mexico, Netherlands, New Zealand, Norway, Poland, Portugal, Slovakia, South Korea, Spain, Sweden, Switzerland, Turkey, United Kingdom and the United States


* CNBC data compilation disclosure: "The Organization for Economic Cooperation and Development (OECD) has tracked corporate tax data from its member countries every year since 1981. The tax rates listed here are “combined corporate income tax rates,” a number that includes both national and local levies. It should be noted that the OECD only compiles corporate tax data on its 30 member countries, which do not include the BRIC nations (Brazil, Russia, India, China), as these countries are not currently full members. The lowest OECD Tax rates belong to Ireland (12.5%) and Iceland (15%)."


Data Courtesy
: CNBC

Friday, May 8, 2009

U.S. Bank Stress Test Assumptions + RESULTS

On Thursday, May 7th, 2009, the U.S Federal Reserve FINALLY unveiled its long-awaited, eagerly-anticipated 'Stress Test' (i.e: the Supervisory Capital Assessment Program) results performed on the country's 19 largest financial institutions. These 19 banks each hold assets of at least $100 Billion and, collectively, are believed to represent about 2/3 of the total assets contained in the entire U.S. Banking system.

Of the 19 U.S. commercial banks tested, 10 banks FAILED and will now need to raise a total of about $75 Billion in additional capital by November of this year. The 3 largest Bank Stress Test LOSERS are: Bank of America/BAC (needs to raise $33.9 Billion in capital), Wells Fargo/WFC (needs to raise $13.7 Billion), and the former wholly-owned financial services arm of General Motors (GM), GMAC/GJM (needs to raise $11.5 Billion).

One of the Treasury's primary litmus tests for the stress tests it conducted revolved around an interesting accounting metric known as Tangible Common Equity or TCE. Tangible Common Equity is designed to indicate how much 'ownership equity' owners of common stock would actually receive in the event of a company's forced liquidation. According to Wikinvest, TCE intends to remove the more subjective components of valuation (intangible assets and goodwill) from the calculation of a company's underlying worth. The accounting formula for the TCE ratio is a company's Total Shareholders Equity MINUS its Intangible Assets (non-physical assets on a company's balance sheet - exp's include: intellectual property, brand recognition), Goodwill (the premium paid by an acquiring company over and above the acquired company's Tangible Book Value) and Preferred Stock as a percentage of Tangible Assets. During the stress tests, the U.S. government made it clear that it strongly urges all 19 commercial banks to maintain a TCE of at least 4% moving forward.


Due to uncertainty regarding the future macroeconomic environment, the Federal Reserve tested the TCE of each of the 19 banks under
2 different economic scenarios - 1.) 'Average Baseline' and 2.) 'Alternative More Adverse'. Per the above chart, the more optimistic 'Average Baseline' case carried the following assumptions for 2009: -2% GDP 'growth', 8.4% unemployment and a 14% decrease in nationwide housing prices. Meanwhile, the 2009 assumptions used by the more pessimistic 'Alternative More Adverse' view were: -3.3% GDP 'growth', 8.9% unemployment and a 22% decline in housing values.


Lastly, it should most certainly be noted that the April's U.S. jobs/payrolls report was released this past Friday and the country's unemployment rate currently stands at 8.9% - already exactly matching the more pessimistic unemployment assumption used in the 'Alternative More Adverse' scenario. According to Dean Baker of the American Prospect, a healthier or more realistic assumption for the country's unemployment rate in 2009 would be 9.4%. It should also be noted that per the above S+P Case/Schiller nationwide 10 city housing prices index graph, the current real decline in 2009 housing prices has also ALREADY virtually matched the housing assumption used in the 'Alternative More Adverse' scenario. Furthermore, most 'experts' believe housing prices will continue to decline in 2009 and probably finish the year down by about 24-25%. As a result and anecdotally thinking, it looks like the assumptions used by the Federal Reserve in their 'Average Baseline' scenario are entirely too optimistic (14% decline in housing??) and disingenuous at best. Meanwhile, the assumptions employed in the 'Alternative More Adverse' scenario don't seem to be pessimistic enough unless the U.S. economy rebounds sometime during the 2nd half of 2009.


marketwatch.com/news/story/Stress-tests-see-possible-600/

http://www.wikinvest.com/metric/Tangible_Common_Equity_(TCE)

prospect.org/csnc/blogs/name=background_on_the_stress_tests


-------------------------------------------------------------------------------------

BANK Stress Test RESULTS -
Scorecard :


10 Banks That FAILED (Ticker) - Capital Needed :
* Bank Of America (BAC) - $33.9 Billion
* Wells Fargo (WFC) - $13.7 Billion

* GMAC (GJM) - $11.5 Billion

* Citigroup (C) - $5.5 Billion

* Regions Financial (RF) - $2.5 Billion

* Suntrust Financial (STI) - $2.2 Billion

* Morgan Stanley (MS) - $1.8 Billion

* Keycorp (KEY) - $1.8 Billion

* Fifth Third Financial (FITB) - $1.1 Billion
* PNC Financial (PNC) - $0.6 Billion

9 Banks That PASSED (Ticker):
* Goldman Sachs (GS)
* JP Morgan (JPM)

* US Bancorp (USB)
* Metlife (MET)

* American Express (AXP)
* Bank Of New York Mellon (BK)

* State Street (STT)

* Capital One Financial (COF)

* BB&T Corp (BBT)


http://www.cnbc.com/id/30626465/


Data Courtesy
: Marketwatch, CNBC + The American Prospect
Full Disclosure: I own shares of GS.

Sunday, May 3, 2009

ECRI Signals The END Of The U.S. Recession

According to the Economic Cycle Research Institute (ECRI) and their proprietary group of leading economic indicators, the END of the grueling U.S. recession that officially began back in December 2007 is FINALLY within sight. Over the last 75 years, economic growth rate cycle upturns during EVERY recession have been followed zero to 4 months later by the actual END of the recession itself.

In TheStreet.com article referenced below, Anirvan Banerji, the director of research for the globally-renowned ECRI, writes that both the U.S. Long Leading Index (USLLI) and the U.S. Weekly Leading Index (WLI) have now been in cyclical upturns for the past 4 months. The growth rate for the USLLI turned up (and has since sustained this trend) in November 2008 while the growth rate for the WLI followed shortly and began its turnaround in December 2008. Along with the rest of ECRI's leading indices, these intriguing developments indicate a business cycle recovery THIS year, and probably by the end of the SUMMER.


Lastly, it should be properly noted that ECRI's leading economic indices correctly predicted the ongoing housing/debt bubble recession. ECRI's Weekly Leading Index (WLI) initially turned negative back in early June 2007, and eventually plunged in December 2007 to levels that had not been seen since the 2001 tech/dot com bubble recession.


thestreet.com/10495033/1/banerji-the-end-of-the-recession.html


Data Courtesy
: ECRI + TheStreet.com

Sunday, April 26, 2009

IBM's 1Q09 Financial Results

Highlights of IBM's 1Q09 Earnings Report:

* Net Income: $2.3 Billion or $1.70/share...down less than 1% from $2.32 Billion in 1Q08


* Total Sales: $21.7 Billion...down 11% from $24.5 Billion in 1Q08 (IBM stated that revenue would have only dropped 4% year over year under constant currency)


* Total Expenses: $6.3 Billion...down 9% from 1Q08

* Effective Tax Rate: 26.5%...down 100 basis points from 27.5% in 1Q08

* Free Cash Flow: $1 Billion...up 80% year over year (yoy) from $550 million

* Stock Buyback: IBM purchased 22 million shares of its own stock during 1Q09 (at 4/26/09's price of $100/share, IBM purchased approx $2.2 Billion of company stock during the quarter)...IBM currently has $3.7 Billion of share buyback authorization remaining


* CASH on hand to end 1Q09: $12.3 Billion

* Service Sales: $13.2 Billion...down 10% yoy (down 2% at constant currency)


* Software Sales: $4.5 Billion...down 4% yoy (up 2% under cc)


* Hardware Sales: $3.2 Billion...down 24% yoy (down 18% under cc)


* 1Q09 Service Bookings: Down 1% yoy to $12.5 Billion (IBM stated that new service contracts revenue would have actually risen 10% yoy under cc)


* Long-Term Service Bookings: Up 14% yoy to $7.0 Billion (up 27% under cc)


* Short-Term Service Bookings: Down 14% yoy to $5.5 Billion (down 5% under cc)


* India sales up 12% year over year


* China sales up 11% year over year


* 2009 Forecast: IBM affirmed its 2009 earnings forecast of at least $9.20/share (...as of 4/26/09, IBM traded at $100.08/share, implying its currently trading at a forward 2009 P/E multiple of approx 11 times earnings)


* 2010 Forecast: IBM affirmed its 2010 earnings forecast of in between $10-$11/share (...as of 4/26/09, IBM traded at $100.08/share, implying its currently trading at a forward 2010 P/E multiple of approx 9-10 times earnings)


http://www.ibm.com/investor/1q09/press.phtml


Data Courtesy
: IBM's 1Q09 earnings press release
Full Disclosure
: I own shares of IBM.

Sunday, April 12, 2009

Australia's $30 Billion BROADBAND Project

While some of the major details are still evolving (...for instance, whether or not Australia will hire private-sector multinational IT companies like Cisco/CSCO, Siemens/SI, IBM, or even Google/GOOG to help out), Australia's government recently committed to a highly ambitious eight-year, $30.5 Billion Internet infrastructure spending project that will aim to significantly boost the country's current broadband network capacity and also, preserve 200,000 Australian JOBS. Per Australia's Prime Minister, Kevin Rudd, the country's LARGEST EVER infrastructure project to date "will support 25,000 jobs every year over the eight-year life of the project", and will also provide citizens with Internet access 100 times faster than currently available speeds.


Some additional bullet points:
* The Australian government plans to form and temporarily own 51% of the new company that will be responsible for making the initial investments of approx $3.4 Billion in order to build and operate the new high-speed Internet network...The government plans to sell its stake in the company five years after the project's completion


* In order to FINANCE the entire $30 Billion undertaking, the government currently plans to sell up to $16 Billion in BONDS to the public and also plans to raise $14.3 Billion via 'private (equity) investment'


* The plan's seemingly earnest objective is to supply 90% of Australian homes with Internet connections of up to 100 megabits per second and the remaining 10% with speeds of up to 12 megabits per second


* According to JPMorgan's Chase & Company's Internet Investment Guide, about 17% of Australia's population had access to high-speed Internet connections in 2008 (this rate compares to 19% in both the U.S. and Japan...and also to 26% in both South Korea and Switzerland)


* Australia's unique geography (many cities densely located on its coast, the sparsely-populated Outback) has made Broadband advancement a difficult issue in the past


* Kevin Rudd, Australia's Prime Minister, made Broadband infrastructure expansion a priority during his 2007 political campaign...According to Reuters, Rudd's current popularity is near-record levels in domestic opinion surveys


* In addition to the $30 Billion (43 Billion Australian dollars) pledged to stimulate Australia's economy via this massive Broadband plan, Australia's government has pledged approx $57 Billion (78 Billion Australian dollars) in economic stimulus since September 2008 (the now infamous date marking the collapse of the artist formerly known as Lehman Brothers)


bloomberg.com/apps/news?pid=newsarchive&sid=akD14lio0T3k


reuters.com/article/rbssTechMediaTelecomNews


Data Courtesy
: Bloomberg + Reuters
Full Disclosure: I own shares of IBM and GOOG.

Sunday, April 5, 2009

March 2009 Payrolls - Dude, Where's My JOB?

According to the U.S. Labor Bureau of Statistics' March 2009 payrolls report, the number of unemployed Americans rose to a jaw-dropping 13.2 million people. During March, the country lost 663,000 jobs and the nation's Unemployment Rate rose to a staggering twenty five year high of 8.5%. The last time the unemployment rate was this high was back in November 1983, when the economy was recovering from the 1981-1982 recession that eventually pushed the jobless rate close to 11%. Perhaps even more disturbing is the fact that nearly 1/4 of all jobless Americans have been unemployed for a period of six months or longer - this is also the highest proportion since the above-cited 1981-1982 recession.

Over the past five months, the country has lost an astounding 3.3 MILLION jobs; including a loss of 2 MILLION jobs during the first three months of 2009. For some perspective and per CNN, if no more jobs are lost in 2009 (mind you, this seems to be a VERY unlikely scenario...), 2009 would still be the 4th worst year for job losses since the government began tracking payrolls data back in 1939. In total, since the recession officially began back in December 2007, the U.S. economy has lost a sickening 5.1 MILLION jobs !


In addition to WIDESPREAD job cuts (virtually every U.S. economic sector lost jobs in March except for 'health care and education services' which actually saw an 8K increase in payrolls), employers also cut back on employee hours. The average hourly employee work week fell to 33.2 hours, the lowest level on record going back to 1964.

Lastly, the country's Underemployment Rate also warrants mention as it continued to rise and ended March at a whopping 15.6% ! FYI, the government's underemployment rate attempts to capture 1.) all unemployed Americans already included in the government's unemployment rate, 2.) those job seekers who have recently given up looking for a job, and 3.) those workers currently holding part-time jobs but are seeking full-time work. The amount of underemployed Americans rose by approx 423,000 in March and now total a RECORD 9 million American workers.


http://www.bls.gov/news.release/empsit.nr0.htm


Data Courtesy
: The U.S. Labor Department

Wednesday, April 1, 2009

The Notorious AIG Bonuses And The LAW

Connecticut Attorney General Richard Blumenthal recently sat down with Fox News commentator Glenn Beck to debate the $220 million AIG bonus fiasco. What transpired was an especially lively and spirited debate focused on the United States government's 'legal authority' to take back the bonuses contractually guaranteed to AIG employees.

In terms of background, American International Group (AIG) is the NOTORIOUS U.S. financial products company that foolishly risked and LOST the house on sour, unregulated credit default swap (CDS) investment bets. The only reason AIG even exists today is because of the U.S. government's highly controversial September 2008 decision to intervene in the financial markets and assume the company's gigantic GLOBAL liabilities. To date, the government has essentially taken over the insurance behemoth by infusing it with approximately $180 Billion in U.S. taxpayer funds in return for an 80% ownership stake.


While I most certainly understand and empathize with the public's justifiable OUTRAGE (...there are after all 180 BILLION reasons to be OUTRAGED over these bonus payouts...), I believe Mr. Beck's assessment is fair and share his concerns regarding precedent and the 'Slippery Slope of LAW' issue now facing the country.


Part 1:


Part 2:


Data Courtesy
: Fox News

Thursday, March 19, 2009

IBM + SUN - An $8 Billion Server-OPOLY ?

According to the Wall Street Journal, 'tech conglomerate' International Business Machines Corp. (IBM) is in talks to purchase storage systems industry peer Sun Microsystems (JAVA). While terms are still being negotiated, rumors suggest IBM is willing to pay up to $8 Billion in cash to acquire its one-time rival. If true, the acquisition would easily surpass the company's $5 Billion purchase of Cognos in January 2008 to become the most expensive deal in IBM's near 100 year corporate history (FYI, Sun currently has about $2.5 Billion in cash sitting on its balance sheet so the real/net cost of the deal to IBM would probably be somewhere around $5.5 Billion).

With the acquisition of Santa Clara, California-based Sun Micro, IBM would immediately be adding some 35,000 new employees and about $13 Billion to annual company sales.
More importantly though, the purchase of Sun would allow #1 IBM to significantly increase its lead in worldwide server marketshare over #2 Hewlett Packard (HPQ). Per the below pie chart, IBM's server marketshare would increase by 10.1% and total 42% as a result of the acquisition...meanwhile, HP's share number holds steady at 29.5%. Scary as that might be, perhaps an even more daunting prospect for the rest of the server industry would be the potential $8 Billion deal's impact on IBM's worldwide UNIX server marketshare. If the deal were to go through and of course pass regulatory approval then IBM's UNIX share would instantly soar an enormous 28 points to a MONOPOLISTIC 65.3% !


Per the below link, IBM appears interested in doing the deal for several reasons, including:


1.) INSTANT MARKETSHARE - IBM will immediately gain 10 points of marketshare in overall worldwide server sales


2.) 'HOT' END USERS - Many of Sun's customers operate in the telecommunication and government sectors of the economy...two end user industries IBM is explicitly targeting and focused on growing during today's relatively tepid macroeconomic backdrop


3.) LEVERAGE IBM's CORE S + S - IBM will attempt to sell its carefully-crafted, higher margin bundles of server-oriented Software + Services to its newly acquired storage system customers


4.) LEVERAGE SUN's CORE R + D - IBM will seek to leverage the fruits of SUN's widely regarded Research + Development efforts (JAVA, Solaris, SQL, solid state storage drives, advancements in cloud computing, etc.) into its own existing and future products/solutions


online.wsj.com/article/SB123742081606578475.html


Data Courtesy: The Wall Street Journal
Full Disclosure: I own shares of IBM.

Thursday, March 12, 2009

Moody's List Of AAA Credit Corporations


Today's Standard & Poors loooooong anticipated downgrade announcement of General Electric's credit rating from AAA to AA+ (the next level down) most likely portends that Moody's Corp (MCO) will be quickly following suit with its own credit ratings downgrade of GE. If Moody's indeed decides to downgrade GE then there will only be 4 companies operating in the S+P 500 UNIVERSE today commanding Moody's HIGHEST Level Credit Rating of AAA:


* Automatic Data Processing (ADP) - a $18 Billion marketcap financial firm


* Berkshire Hathaway
(BRKA) - a $130 Billion mcap insurance conglomerate


* Exxon Mobil
(XOM) - a $330 Billion mcap oil and gas company


* Microsoft
(MSFT) - a $150 Billion mcap technology company


* TIAA-CREF
(private...not in the S+P 500) - a not-for-profit retirement organization for 3 million people


FYI,
A triple A credit rating is desirable as it essentially allows companies to borrow money at the cheapest interest rates possible (allowing said company to maximize potential returns from that borrowed money). General Electric held Standard & Poor's AAA credit rating since 1956. Per its most recent annual company filings with the SEC, and under the terms of its existing debt instrument guarantees and covenants, GE would have to post additional collateral on its long term debt if its credit ratings were to be cut four more levels to below AA-/Aa3.


bloomberg.com/apps/news?pid=20601087&sid


Data Courtesy
: Bloomberg
Full Disclosure
: I own shares of GE.

Tuesday, March 10, 2009

WELCH - Obama Needs To 'CHANGE' + Focus

Highly regarded former General Electric CEO and New York Times best selling author, Jack Welch, was interviewed this morning in an interesting economy-centric segment on MSNBC's Morning Joe. Mr. Welch served as Chief Executive Officer of GE from 1981 through 2001 and under his stewardship, the company increased its sales by some 380% (from revenues of $27 Billion in 1980 to $130 Billion in 2000) !

In the below three minute clip, the highly accomplished and often dynamic Mr. Welch shares some of his candid, proprietary, 'STRAIGHT FROM THE GUT' thoughts on President Obama and the current timetable of his ambitious agenda (FYI, President Obama's 2009 budget currently forecasts $3.2 TRILLION of government spending). Worth the watch:


Data Courtesy
: MSNBC + Youtube

Sunday, March 8, 2009

GE's $50 B JOKER-Like Real Estate Exposure

Since April 4th, 2008, the stock of U.S-based 'super conglomerate' General Electric (GE) has been in an absolutely vicious, nauseating downtrend falling from $37.56 a share to today's difficult-to-fathom price of just $7.06/share (FYI, please note the fitting JOKER-like portrait of GE CEO Jeff Immelt above). GE, a once near $600 Billion GOLIATH of a company, has been crushed by the simultaneous burstings of the REAL ESTATE and CREDIT asset bubbles and seen its market value shrink a jaw-dropping 80% over the past 11 months!

The reason for the steep, GUT-wrenching decline??? The vast amount of Joker-like UNCERTAINTY surrounding the value of General Electric's ENORMOUS and OPAQUE
$650 Billion GE Capital business, and more specifically, its $50 Billion plus global REAL ESTATE portfolio
. For some perspective, the size of GE Capital is roughly equivalent to the size of the U.S's 6th largest bank.

Further complicating matters is the
Joker-like accounting methodology GE Capital currently uses to value its holdings. The world's largest maker of jet engines and power turbines told shareholders last week that only 2% of GE Capital Corp's $650 Billion portfolio of assets are being valued today based on current market prices (i.e: marked to market). According to CreditSights Inc, an independent bond research firm based out of New York, the remaining 98% or some $624 Billion of GE Capital assets (most of which are loans or senior secured debt tied to assets like aircraft) are being valued at levels that General Electric established many years ago! Per the bottom referenced Bloomberg link, here are some quick facts related to GE Capital's dubious real estate unit, GE Real Estate :


* GE Capital generated $8.6 Billion or 48% of General Electric's $18.1 Billion of profits in 2008...that compares with about 20% in the late 1980's...General Electric expects GE Capital to contribute $5 Billion of profits in 2009


* GE Real Estate profits fell by $1.1 Billion in 2008 (vs. 2007)
...On January 23rd, 2009, GE stated that GE Real Estate will take more than $4 Billion in pretax losses and post an overall loss of about $500 million in 2009


* According to SEC regulatory filings, General Electric's commercial real estate business consists of both property and real estate loans. The company has stakes in or financing on 8,000 different properties scattered in 2,600 cities with an average investment of less than $10 million


* According to Keith Sherin, General Electric's Chief Financial Officer, GE has about $50 Billion of commercial real estate loans and $2.9 Billion of commercial mortgage-backed securities


* GE takes a conservative (...ironic that shareholders should actually read this word as 'DANGEROUS'...) approach in terms of accounting for the value of its real estate holdings as the company's 'mark to market' methodology is similar to the accounting used by real estate investment trusts. GE accounts for its property holdings at the price they paid for them and then chooses to depreciate the values over time rather than actually marking the assets to their current market values. According to GE spokesman Russell Wilkerson, GE's property portfolio currently generates about $1.7 Billion in profits while the company depreciates the assets by about $1.1 Billion per year. GE is currently forecasting loan reserves of (only) 2.5%.


* GE's property includes office buildings, warehouses and apartments...about 71% of GE's properties are located outside of the U.S., primarily in Europe, Asia, Canada and Mexico


* GE owns about $22 Billion of real estate assets in Europe...about 1/3 of which consists of real estate debt and non-performing loans


* In November 2007, GE purchased $2.8 Billion of commercial real estate loans from England's Bradford & Bingley. According to Investment Property Databank, U.K. commercial property values had fallen only 3% from their July 2007 peak at the time of GE's purchase...now prices have fallen 37% from that peak


* In 2006, GE purchased Arden Realty Inc. for $3.2 Billion...at the time, Arden was the largest publicly traded land owner in Southern California


bloomberg.com/apps/news?pid=20601109&sid=ary2g22


Data Courtesy: Bloomberg

Friday, March 6, 2009

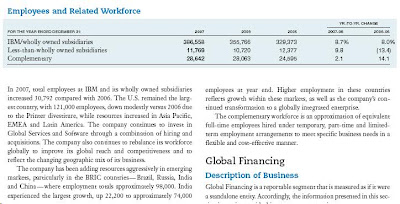
IBM's Worldwide IT Labor Force At A Glance

* IBM is the largest Information Technology employer in the United States

* As of year end 2008, IBM employed 398,445 people worldwide including 115,000 people (or 29%) in the United States

* As reported by the company last week, IBM now employs a total of 113,000 jobs in the B.R.I.C. countries (Brazil, Russia, India and China)

* Per IBM's 2007 Annual Shareholders Report (double-click for a larger view):


http://www.cnbc.com/id/29546391/page/2/


Data Courtesy
: CNBC + IBM's 2007 Annual Report
Full Disclosure: I own shares of IBM.

Wednesday, March 4, 2009

14 Million 'UNDERWATER' U.S. Homeowners

According to Moody's Economy.com, an estimated 13.6 million U.S. borrowers ended 2008 UNDERWATER on their home mortgages. FYI, 'underwater' borrowers refers to those individuals being in the difficult and unfortunate position of currently owing more on the mortgage of their property than the actual underlying value/WORTH of the property itself.


Per the above Wall Street Journal chart, this figure is projected to rise in 2009 and is up from the 11.8 million homeowners that were underwater at the end of 3Q08. Lastly, please note that as recently as 2Q07, the number of underwater homeowners was only 4 million. Since then (...ENTER the July 2007 seismic collapse of the U.S. SUBPRIME mortgage market...), this figure has exploded upwards by
nearly 10 million or 250% !


Data Courtesy
: Economy.com + The Wall Street Journal