Showing posts with label opec. Show all posts

Wednesday, August 27, 2008

OPEC's Worldwide SHARE of Crude OIL

According to Bloomberg, OPEC's (The Organization of Petroleum Exporting Countries) Share of WW Crude Oil Production is about 42%.

--------------------------------------------------------------------------

Somewhat Related (and also according to the below Bloomberg link) :

* The GULF of Mexico is responsible for producing about 14% of the United States' total Oil + Gas PRODUCTION

* The U.S. Gulf coast along Louisiana and Texas is home to about 42% of the U.S.'s total Crude Oil REFINING CAPACITY


bloomberg.com/apps/news?pid=20601087&sid=awi3JTmcVadg&refer=home


Data Courtesy: Bloomberg

Friday, June 27, 2008

RTOB: FOOD vs FUEL - A New WORLD WAR ?

Are we in the early stages of a New COMMODITY based WORLD WAR ?

Is the United States playing a DANGEROUS GAME with the Middle East by COUNTERING worldwide OIL price hikes with worldwide increases in the cost of FOOD ? I'm no 'conspiracist' but consider some quick observations :


The FUEL Side
* Supply Manipulation ? --> Crude oil supply is primarily controlled by the Middle East via the OPEC Cartel. Per Wikipedia, the 13 members of OPEC control about 2/3 of the world's crude oil reserves + approx 36% of the world's total current crude oil production. FYI, OPEC members include many countries that fundamentally dislike the United States for many reasons including its often criticized ties to + support of Israel...OPEC 'troublemakers' include countries like Iran, Libya and Venezuela.

* Principle Fuel Commodity --> About 40% of the total energy consumed in the U.S. in 2007 was crude oil. The U.S. is the world's largest consumer of oil and consumes about 21 million barrels of crude oil a day - 3 times the daily amount consumed by 2nd place China (for a top 5 list on the largest consumers of crude oil please refer to my 5/21/08 reference post titled 'REF - World's Largest Oil Consumers). The U.S. imports about 70% of its annual crude oil needs and at $140 oil, is primed to spend over $700 Billion this year on importing Oil into the U.S. (this is 5 times the annual cost of the Iraq war!!).

* PRICE Manipulation ? --> The price of Crude Oil has risen over 700% since November 2001...from $17.50 a barrel to about $140 a barrel today.


The FOOD Side
* Supply Manipulation ? --> The U.S. is the world's largest producer and exporter of Corn. According to Wikipedia, the U.S. is responsible for producing about 40% of the World's total annual corn supply (in 2005 the U.S. produced 280 of the World's total 692 ton harvest). Due to subsidies following the U.S. government's 2005 ethanol from corn 'flex-fuel' mandate, the U.S. now allocates about 30% of its total annual corn crop to the creation of corn-based ethanol...a fuel that supplies less than 5% of the country's annual automotive energy needs.

* Principle Food Commodity --> Corn is a principle food commodity used by farmers for feeding the world's livestock (cattle, chickens, etc.)...therefore an increase in the 'input' cost of corn results in higher costs for maintaining livestock and ultimately results in higher prices for foods like beef, chicken, ham, goat, etc. While the average U.S. consumer spends about 15-20% of their disposable income on FOOD and groceries, the average consumer in emerging nations like Iran, Venezuela and even Saudi Arabia (minus the royal family of course) spend roughly 40-50% of their total disposable income on food. Therefore, while food price inflation in the U.S. is annoying, it's downright CRIPPLING for a majority of emerging countries that often have high levels of income disparity among their respective populations.

* PRICE Manipulation ? --> The price of Corn has risen 250% since September 2006...from $2.25 a bushel to today's price of around $7.86 a bushel.


Data Courtesy: Wikipedia + previous posts

Friday, June 6, 2008

REF - The Strategic Petroleum Reserve (SPR)

Some Wikipedia Facts on the U.S. Department of Energy's Strategic Petroleum Reserve (SPR):

* The Strategic Petroleum Reserve is an EMERGENCY Crude Oil 'Store' maintained by the United States Department of Energy via mostly underground crude oil storage facilities...the SPR is Exclusively a CRUDE OIL Reserve, it is not a stockpile of refined petrochemical products, such as gasoline, diesel and kerosene

* The SPR is the World's Largest Emergency crude oil supply with CAPACITY to hold up to 727 million barrels of oil (fyi, the 2nd largest emergency supply of petroleum is Japan's with a 2003 reported capacity of 579 million barrels)...The reserve is stored at four sites on the Gulf of Mexico...the SPR's facilities COST close to $4 Billion to construct


* The United States started the SPR in 1975 with the objective of minimizing severe supply disruptions after oil supplies were cut off by OAPEC (OPEC plus Egypt and Siria) during the 1973-1974 Oil Embargo (http://en.wikipedia.org/wiki/1973_oil_crisis)

* The current inventory is displayed on the SPR's web site. As of June 6th, 2008, the current inventory was 704.2 million barrels. At $130 a barrel, the SPR holds over $90 billion worth of Crude Oil...According to the CIA World Factbook, the United States imports a NET 12 million barrels of oil a day, so the SPR holds about 58 Days worth of Crude Oil Imports. (However, the maximum total withdrawal capability from the SPR is only 4.4 million barrels per day, making it a 160 + Days of Imported Supply)

* Between the U.S. government's SPR + supply estimates of the U.S. PRIVATE sector's 'protected' oil inventory, it is believed that the U.S. has about 115 days worth of 'protected' Crude Oil Imports Supply
------------------------------------------------------------------------
* FYI, on May 16, 2008, the Department of Energy announced it was canceling its daily oil shipments (70,000 barrels a day) into the SPR beginning in July, 2008. The U.S. hopes a temporary halt to SPR stockpiling will increase available crude supplies on the market and thereby reduce the cost of oil.

Data Courtesy: Wikipedia

Monday, March 31, 2008

GRAPHS - Global Oil Prices + Inventories

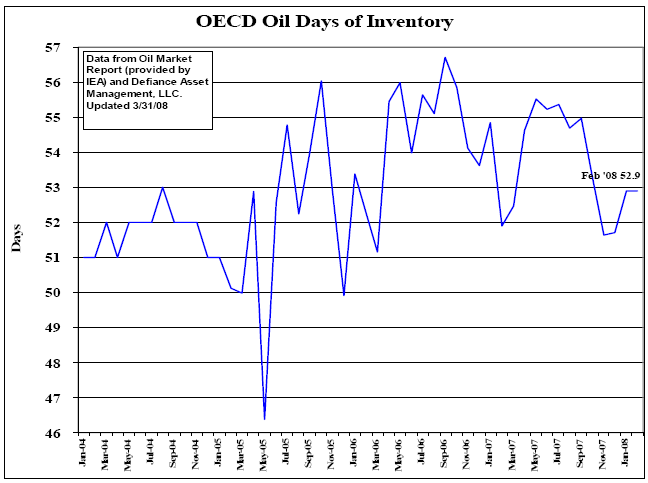
For some perspective on crude oil supply, check out the link below to an interesting GRAPH by the IEA (International Energy Agency) showing the change in Days of Global Oil Inventory (WW SUPPLY) since January 2004.

It's interesting to see that even though OIL prices have been in a steep uptrend since 2004, oil inventories have remained relatively FLAT worldwide. More specifically, while oil prices have increased 225% since January 2004 ($30.81/barrel!), days of global inventory/supply have only increased 4% (an increase of about 2 days worth of supplies to the market)!

The million dollar question should now be, WHY isn't new SUPPLY FLOODING the market when oil prices are over 200% higher than they were 4 years ago?? In a perfect world and per the economic textbooks we read in high school, oil producers should be doing all they can to churn out more supply and meet market demand at the VERY PROFITABLE $100/barrel level. I believe this graphs adds validity to the argument that higher energy prices are in the cards because crude oil is a long term supply problem (price activity is being driven by SCARCITY). Anyways, who knows why oil supply is currently constrained (...MAYBE the producers + OPEC are manipulating supply numbers and production activities to power the price higher? MAYBE its just huge demand from India and China...), BOTTOM LINE is that it looks like the long term trend in prices remains HIGHER until either WW demand DRAMATICALLY slows down or WW supply (as measured by the days of oil inventory) DRAMATICALLY increases.

As a long term energy investor I remain excited about the possibility of higher trending prices...as a lowly consumer though I'm a little bit worried about the ramifications..

*Graph on recent Oil Supply (Inventories):
http://images.thestreet.com/tsc/common/images/storyimages/033108_cod.gif


Data Courtesy: Wikipedia + TheStreet.com