Showing posts with label China. Show all posts

Wednesday, June 3, 2009

U.S.'s $160 Billion INFRA Status + Roundtable

According to Bloomberg, of the $162 Billion dollars of INFRASTRUCTURE aid the U.S. federal government pledged to spend in February as part of its unprecedented $787 Billion Economic STIMULUS package, only about $50 Billion, or 31%, has been paid out thus far. As a result, it can be reasonably concluded that most global infrastructure/industrial companies that stand likely to benefit from the massive U.S. stimulus program (Examples include: CAT/Caterpillar, GE/General Electric, DE/Deere, FWLT/Foster Wheeler, FLR/Fluor, UTX/United Technologies, ETN/Eaton, JEC/Jacobs Engineering, SGR/Shaw Group, MDR/McDermott, HON/Honeywell, TEX/Terex, etc.), will not see the desired effects on their respective companies' balance sheets until towards the end of 2009/beginning of 2010.

Somewhat related, the uber powerful and equally innovative CEOs of both Caterpillar (CAT) and Google (GOOG) appeared on MSNBC's Meet The Press program on Sunday, May 31st, 2009. During the engrossing CEO roundtable discussion hosted by David Gregory (the clip is included below), both rock star executives shared their insightful assessments of the current state and future direction of the U.S. economy. I found it particularly interesting to listen to Jim Owens' take since he leads the operations of a company very much at the manufacturing heart of the U.S. economy. Among Mr. Owens' more interesting comments, the CEO of Caterpillar expects the global economy to BOTTOM sometime during the 3rd quarter of 2009. He also, perhaps somewhat tellingly, doesn't expect his company to resume hiring until mid 2010.


http://bloomberg.com/apps/news?pid=20601109&sid=aUfrUQkdTg1s


Data Courtesy: Bloomberg and MSNBC
Full Disclosure: I own shares of GOOG, CAT, DE and GE.

Sunday, April 26, 2009

IBM's 1Q09 Financial Results

Highlights of IBM's 1Q09 Earnings Report:

* Net Income: $2.3 Billion or $1.70/share...down less than 1% from $2.32 Billion in 1Q08


* Total Sales: $21.7 Billion...down 11% from $24.5 Billion in 1Q08 (IBM stated that revenue would have only dropped 4% year over year under constant currency)


* Total Expenses: $6.3 Billion...down 9% from 1Q08

* Effective Tax Rate: 26.5%...down 100 basis points from 27.5% in 1Q08

* Free Cash Flow: $1 Billion...up 80% year over year (yoy) from $550 million

* Stock Buyback: IBM purchased 22 million shares of its own stock during 1Q09 (at 4/26/09's price of $100/share, IBM purchased approx $2.2 Billion of company stock during the quarter)...IBM currently has $3.7 Billion of share buyback authorization remaining


* CASH on hand to end 1Q09: $12.3 Billion

* Service Sales: $13.2 Billion...down 10% yoy (down 2% at constant currency)


* Software Sales: $4.5 Billion...down 4% yoy (up 2% under cc)


* Hardware Sales: $3.2 Billion...down 24% yoy (down 18% under cc)


* 1Q09 Service Bookings: Down 1% yoy to $12.5 Billion (IBM stated that new service contracts revenue would have actually risen 10% yoy under cc)


* Long-Term Service Bookings: Up 14% yoy to $7.0 Billion (up 27% under cc)


* Short-Term Service Bookings: Down 14% yoy to $5.5 Billion (down 5% under cc)


* India sales up 12% year over year


* China sales up 11% year over year


* 2009 Forecast: IBM affirmed its 2009 earnings forecast of at least $9.20/share (...as of 4/26/09, IBM traded at $100.08/share, implying its currently trading at a forward 2009 P/E multiple of approx 11 times earnings)


* 2010 Forecast: IBM affirmed its 2010 earnings forecast of in between $10-$11/share (...as of 4/26/09, IBM traded at $100.08/share, implying its currently trading at a forward 2010 P/E multiple of approx 9-10 times earnings)


http://www.ibm.com/investor/1q09/press.phtml


Data Courtesy
: IBM's 1Q09 earnings press release
Full Disclosure
: I own shares of IBM.

Sunday, April 12, 2009

SOROS - 'Two Moves' And Only A Bear Rally ?

Say what you want about BILLIONAIRE George Soros and what you may perceive his influence on U.S. party politics may (or may not) be, the truth is that few market participants have been as RIGHT (pun INtended) as the founder of Soros Fund Management when it comes to sound investment decision-making post the mid 2007 credit/mortgage bubble collapse. While the S+P 500 market index lost a sickening 39% in 2008, Mr. Soros astutely spent the year mostly betting against the volatile global markets and actually ended 2008 up 8% (FYI, the average hedge fund declined 19% in 2008). Through February 2009, Mr. Soros' management firms oversaw $21 Billion and its Quantum Endowment hedge fund was up 5.3% on the year.

Given his recent high-level of market 'RIGHT-eousness' (a technical term I coined for being right about the markets), Mr. Soros' interviews now approach those starring former Oppenheimer & Co. banking industry analyst, Mrs. Meredith Whitney, when it comes to being officially REQUIRED Viewing Material ('RVM'). In the below twenty five minute segment, Mr. Soros shares his valuable insight on several relevant, pressing financial market TOPICS including: The S+P 500's ongoing rally off its twelve year lows on March 9th, 2009 (the 27% gain is the largest percentage-based rally for the S+P 500 since 1933)...FASB's recent controversial decision to alter the definition of Mark-to-Market accounting (this will effectively allow U.S. banks to have much more accounting flexibility, or 'creative freedom', when it comes to judging the balance sheet value of their own notoriously large securitized asset loan portfolios including those distressed assets levered to residential and commercial real estate)...The current state of the U.S. financial system and the fundamentally insolvent state of affairs surrounding its largest 'zombie banks' including Citigroup (C) and Bank Of America (BAC)...Thoughts on the timing of a potential U.S. housing bottom...Global economic recovery thoughts focused on B.R.I.C. countries Brazil and China, ETC. :


Data Courtesy
: Youtube + Bloomberg

Friday, March 6, 2009

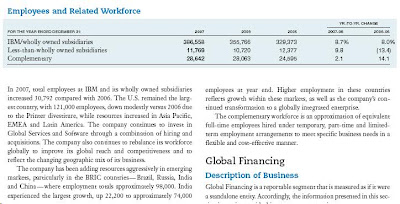
IBM's Worldwide IT Labor Force At A Glance

* IBM is the largest Information Technology employer in the United States

* As of year end 2008, IBM employed 398,445 people worldwide including 115,000 people (or 29%) in the United States

* As reported by the company last week, IBM now employs a total of 113,000 jobs in the B.R.I.C. countries (Brazil, Russia, India and China)

* Per IBM's 2007 Annual Shareholders Report (double-click for a larger view):


http://www.cnbc.com/id/29546391/page/2/


Data Courtesy
: CNBC + IBM's 2007 Annual Report
Full Disclosure: I own shares of IBM.

Thursday, February 12, 2009

CRAMER - Obama's $800B Stimulus Is A FRAUD

Stock market commentator Jim Cramer is EXTREMELY negative ('bearish') on the final version of the $789 Billion U.S. economic stimulus package that is making its way through Washington. According to Cramer, host of CNBC's popular stock market-themed television show Mad Money, Congress and President Obama both deserve an 'F' for the passage of this 'total fraud' of a plan. Perhaps more significantly, Mr. Cramer sees NO actionable stock trades as a result of this package (as a humble fan of CATERPILLAR/CAT, I find this point particularly discouraging). Please find his sobering take below courtesy of TheStreet.com :

Data Courtesy: TheStreet.com

Sunday, December 14, 2008

China Will Grow Money Supply 17% In 2009

In a monetary policy effort designed to counter slowing domestic growth in the world's 4th Largest economy, China's State Council plans to INCREASE the country's M2 Money Supply by 17% in 2009 (money supply: the total amount of money existing in an economy at a particular time...M2 money supply: those types of monies including all physical cash reserves and banking deposits...FYI + if you're curious re the different classes/types of money supply, please refer to my 3/16/08 post titled 'Components Of Money Supply').

According to the People's Bank Of China, China's Money Supply grew to $6.7 Trillion in November 2008...a 14.8% increase over November 2007.

bloomberg.com/apps/newsablWg2RUlVmk

----------------------------------------------------------------------------

* In addition to boosting its Money Supply, the Chinese government also plans to INCREASE financial institution lending activity by $584 Billion in 2009 (4 Trillion Yuan)


* The Chinese Central Bank's key one year lending rate is currently at 5.58% (down from 7.47% as recently as in September)


bloomberg.com/apps/news?pid=newsarchive&sid=ah_2uEppubgU


Data Courtesy
: Bloomberg

Tuesday, November 18, 2008

India's 'Big Dig' - The Rural ROADS Project

Since 2003, India's government has been working on a Large-scale, domestic project of building a MASSIVE Network of ROADS connecting previously unconnected sections of India's largest and most rural populations. For some perspective, India is adding 62 miles of ROAD EACH day. The project is expected to complete in two years (2010)...once complete, all Indian villages with 1,000 residents or more will have access to 'all-weather' roads (this figure is up from 40% when construction began in 2003).

In terms of stimulating India's slowing economy (by the way, India is still the 2nd fastest growing country in the world...China is #1...some annual IMF numbers are provided below), the ROADS project speaks for itself in terms of job creation and productivity enhancements. Expanding a little further on the idea of productivity enhancements, one should not OVERlook the impact this ROADS project will ultimately have on India's Retail environment and Domestic consumer. The below article details a couple of interesting and culturally significant examples about the various types of consumer productivity gains that can be had courtesy of the ROADS project :


bloomberg.com/apps/news?pid=20601109&sid=anT08lWTqguk&


Per the above link:
* India's National Rural Roads Development Agency is overseeing + in charge of spending for the $27 Billion ROADS infrastructure project...the Rural Roads program is being funded by India's government using revenue from a tax imposed on the sale of diesel fuel

* The International Monetary Fund forecasts India's economy to grow 6.3% in 2009 (vs. 7.8% in 2008)...The IMF expects China's economy to grow 8.5% in 2009 (vs. 9.7% in 2008)

* Domestic consumer spending currently makes up 55% of India's economy (GDP)...in comparison, domestic consumption only accounts for 37% of China's export-heavy economy

* According to Haier Appliances (China's largest home appliances retailer that now has operations in India) :

Only 20% of Indian households own a refrigerator

Only 27% of Indian households own a television

Only 3% of Indian homes have air-conditioning installed


Data Courtesy: Bloomberg

Saturday, August 16, 2008

Is BEST BUY Shopping 4 A Future In RUSSIA ?

Best Buy INC. (BBY), the largest consumer electronics Retailer in the United States and Canada, appears to be taking a good look at RUSSIA (the 'R' in BRIC) as a possibility for expanding its current GLOBAL footprint (BBY currently operates over 1,300 retail locations throughout the United States, Canada, Puerto Rico, China, Mexico and Turkey). Earlier this month, the $20 Billion MULTInational corp received Russian government approval for trademark rights belonging to the 'Future Shop' brand in Russia. While Best Buy has yet to publicly voice any formal expansion plans regarding entry into the former Soviet Union, one (and by 'one' I mean 'I') has (and by 'has' I mean 'have') to believe that the large Russian market offers both attractive Sales GROWTH and excellent Geographic Sales DIVERSIFICATION opportunities to the largely North American business.

FYI, In addition to operating 'Best Buy' branded stores throughout North America,
Best Buy INC. wholly owns and operates more than 150 'Future Shop' retail locations...most of which (over 130 stores) are located in Canada.

http://www.reuters.com/article/ousiv/idUSLF59351520080815

According to the Reuters link above, Best Buy filed its trademark applications with Russia's government patent agency, Rospatent, back in 2006. While trademark protection for 'Future Shop' has been received, BBY is still awaiting Rospatent's decision on the company's more well known trademark/brand name - 'Best Buy'.

-------------------------------------------------------------------------------

* Best Buy INC. wholly owns several SUBSIDIARIES including: Future Shop...Geek Squad...Magnolia Audio Video...Pacific Sales (Kitchen and Bath Centers)...Speakeasy, etc.

* In addition to the above listed wholly owned subsidiaries, BBY also owns sigificant stakes in both Best Buy Mobile (a joint venture with London-based Carphone Warehouse - Europe's largest independent cell phone retailer) and China's Five Star. Best Buy owns a 75% majority interest in Five Star, one of China's largest appliance and consumer electronics retailers. As of March 1st 2008, Best Buy operated 160 Five Star retail locations in China.

* Best Buy acquired Vancouver-based Future Shop in March 2001 for 500 million Canadian dollars.

* As mentioned above..In total,
Best Buy currently operates around 1,300 retail locations throughout the United States, Canada, Puerto Rico, China, Mexico and Turkey.


Data Courtesy
: Reuters + Wikipedia
Full Disclosure: I own shares of BBY.

Wednesday, July 23, 2008

BTU 2Q08 Earnings Recap

Peabody Energy 2Q08 Earnings Report Stats:

Beat ?: YES (reported $0.86 cents/share vs estimates of $0.54/share...115% earnings per share growth over 2Q07's 40 cents)

Profits --> Up 115% to $233 million (from $108 million)
Sales --> Up 43% to $1.53 Billion (from $1.07 Billion)


2Q08 Total Coal Production Sales Vol --> 59.8 million tons (vs. 57 million tons during 2Q07)

2Q08 Export Coal Production Sales Vol --> 7 million tons (12% of total production)...The Wyoming Powder River Basin (PRB) contributed to 14% of exports or about 1 million tons


Other Highlights + Guidance:

* BTU now generates more than 50% of its Profits from outside of the U.S. compared to just 1% five years ago

* BTU's Australian Metallurgical Coal contracts (for deliveries through March 2009): priced at $300 a metric ton, or about TRIPLE year-ago pricing

* BTU's Seaborne Thermal Coal contracts were being priced at $125 per metric ton, more than double a year earlier

* Total 2008 U.S. Coal Exports are expected to increase by 50% this year to at least 75 million tons, according to the U.S. Energy Department (EIA), as European utilities purchase supplies normally used by generators in the Northeast

* Australia produces 60% of the world's Seaborne coal used in STEEL-making
* BTUs Australian production volumes increased 15% year over year...BTU averaged prices of $95 a ton for all Australian coal (thermal + met) production, compared to $55/ton during 2Q07
* BTU's 2Q08 Australian coal production margin exceeded $43 per ton
* BTU has much as 14 million tons of Australian coal that's unpriced for 2009 and up to 24 million tons available for resale in 2010, of which nearly half in both cases is metallurgical coal (the highest margin type of coal).

* China's Seaborne Thermal Coal Demand Opportunity: China has 'idled' more than 60 coal plants because coal inventories have shrunk to less than 3 Days Supply...China has also trimmed its coal exports by more than 8% this year and announced plans to lower or eliminate its coal import tariffs

* India's Seaborne Thermal Coal Demand Opportunity: India will need 78,000 megawatts of new coal-fueled generation by 2012, meaning an additional 265 million tons of coal use in that country.


Conference Call Quotes:

* BTU's CEO Gregory Boyce on WW Coal Supply + Demand Fundamentals: "With the recent oil and gas prices near record levels for even the long-dated products, the world is returning to coal in growing amounts. That is why coal remains the fastest growing fuel in the world for each of the past five years. Within the global coal markets, the dynamics we first told you about years ago are only growing stronger. Global coal demand is growing in BOTH the THERMAL and METALLURGICAL front. Some of the largest coal producing nations either can't export more or are limiting exports to fuel internal growth. Global steel demand continues to grow at 6% per year, requiring ever more mettalurgical coal. A new coal fuel generation is being developed in scores of nations around the world; all of this leading to a 7% compound growth rate in seaborne coal demand. On the SUPPLY SIDE, major coal exporters are straining to keep up against the sustained demand growth. All aspects of the coal chain are under pressure and more nations than ever are seeing the valuable resource that their coal represents, forcing coal suppliers to keep greater amounts of coal at home. Combined, these effects are driving continued record prices and we believe global supply and demand is even tighter than many think, due to severe stockpile shortfalls around the world in places such as China, India, Indonesia, and South Africa...What happens in the global market... looks back to what's happening in the U.S. So, REGARDLESS of some certain economic factors that are happening in the U.S. that would lead us to come to one conclusion but that's NOT really what's driving the overall commodity market and the coal market. At the end of the day it's a GLOBAL factor, so as the prices around the world continue to increase and stay strong because of the shortage of supply and the high demand..."

* BTU CEO on the BTU's Opportunities + Future: "The global market fundamentals create significant opportunities for Peabody through four areas; Peabody's unmatched Global Platform, our ability to Reprice Legacy Contracts, our Organic Growth Potential and Peabody's strong Cash Flow profile...Five years ago, just 1% of our earnings came from outside the U.S. And now this is more than half...the benefits to our earnings as we reprice former contracts in the new market environment will be considerable. These two are just starting to flow through our 2008 results. Our EBITDA margin in the second quarter was 29% and we expect it to continue to increase...These commitments include plans for a very strong second half and even higher earnings than the first...In summary, we are seeing record coal prices, sustained growth in coal demand and an improving competitive advantage for coal over other fuels. More importantly, Peabody has expanding margins from a growing platform and improved pricing. We have the ability to REPRICE the MAJORITY of our production over the next several years at levels SIGNIFICANTLY higher than current marks. Simply put, it is a great time to be the world's largest coal company."

* BTU President Richard Navarre on Domestic U.S. Coal Production: "In the U.S. markets, we are seeing export demand is creating great opportunities in the Illinois Basin, the Powder River Basin and Colorado that we expect will carry through 2008 and beyond. We believe net exports will have grown more than four-fold in just two years. And (total U.S. coal) exports may well exceed a 100 million tons in 2009. We have also seen U.S. stockpiles coming down very sharply, down 17% over prior-year levels. And we believe all regions are below or near their targeted level, with plenty of summer burn left...We have more than 90 million tons of coal that's unpriced for 2010 out of both PRB and the Illinois Basin just from our existing operations. We told you earlier in previous calls that the competition that was being created worldwide by European utilities seeking U.S. coal would lead to significant moves in the U.S. markets that would ultimately flow back to the Powder River Basin. And that is just what has occurred. Published Powder River Basin prices for 2010 delivery have increased more than 80%, since the beginning of the year and are now in excess of $20 per ton. In the Illinois Basin, we've seen the same issue where prices have more than doubled during that same period of time. And I'll remind you that Peabody has the largest Illinois Basin position with more than 30 million tons in sales. We believe that the strength in the global coal market is very long term in nature, and expect this will result in very attractive coal prices for many years."

* BTU CEO on International Growth Opportunities: "And then from the international side, we've got a number of opportunities in Australia that now that we've got the platform up and running and performing well, we're looking at what the opportunities that we have to grow organically in Australia similar to what we've done everywhere, every other platform that we have. And we do have some opportunities that we're starting to put some good engineering average into. That takes this into the real greenfield, new area developments. Mongolia is one of those. Clearly our initiatives in China will be another one of those and then you mentioned Mozambique. In Mongolia and Mozambique, the real focus will be mettalurgical coal developments and China would be both thermal coal and when I say thermal coal in China that includes coal for their chemical feedstock business as well as coal for power generation. Mozambique in particular, we've had a number of times that we've spent over in Mozambique and we continue to look at the structure of the industry what's happening in terms of the infrastructure development in Mozambique, both in terms of rail and port developments and then looking at the types of lease holdings that are available in Mozambique and/or development partners.

* BTU CEO on Supplying Growing South America Coal Demand: "When you are talking about South America really in terms of major producing regions or a potential to be major producing regions, you're are talking about Venezuela and Colombia. You know, we're in Venezuela. I mean everybody is well aware of the turmoil that Venezuela has kind of been going through. We see it as very unlikely that there's going to be major investment in new mine developments in the near term in Venezuela. So they're going to be where they're at and maybe struggle to maintain that level of production.When you look at Colombia, lot of discussions and a lot of talk about how Colombia is going to increase production to a next level. But every time you turn around, they are being delayed. They still have labor issues. They have permitting issues. Suffice to say is our view is they will increase over time. Probably going to be bit slower than what some people think, and most of that is very good quality thermal coal probably going to be almost exclusively dedicated for the European market, now that South Africa continues to over time short that market. So at the end of the day if you look at WHERE are major sources of additional coal for the seaborne markets, in the near term, it's Illinois Basin coal and it's PRB coal as you continue to have Colorado, Illinois and Eastern coals exported out of the U.S. and the Powder River Basin back drilling for all of those coals.

* BTU CEO on Coal-to-Gas Technology: "Well coal-to-liquids, coal-to-gas, it's really a story of two different parts of the world. You got the U.S. as one part and you got the rest of the world as the other. Let's look at what's happening Outside of the U.S. Coal-to-liquids, coal to industrial feedstock gas, coal to natural gas is really taking off. You've got a significant amount of new construction and plants coming online in China. You've got coal-to-liquids plant now operational in Australia. You've got... and on the drawing board a number of locations elsewhere. And then of course, you've got continued expansions of the coal-to-liquids platform in South Africa. So, then you get at the U.S. and just say where do we stand in the U.S? It's a combination here of both the ever-rising capital costs for these types of facilities still looking to find contractual commitments for off takes that go out longer than say a five-year period of time. You'd like to see something in the ten-plus years before you commit the capital. And then lastly, there is still the lack of a full regulatory program and permitting U.S. program for CO2 capture and storage, which most of the folks, particularly ourselves are looking at these types of facilities, are looking for those things to come into place at some point early on in the project life. But having said all of that, major expansions internationally, our view is the U.S. will catch up as soon as we get beyond the uncertainties of the election get into '09 and '10 and start to bring some certainty around the permitting and the legal environments around carbon storage.

* BTU Ceo on the U.S.'s Competitive Advantage - Coal Export CAPACITY: "The port capacity, obviously if you go to, lot of places you will see a name playing capacity, if you will of all of port facilities in United States. That number is somewhere between 165 and 175 depending upon who you talk to. We would tell you that the practical capacity in our view, after assessing the facilities and owning 37% of DTA and using facility, it is probably about a 125 million ton. This country has done that in the past. So and that's why U.S. has become one of the major swing supplier in this tight markets globally. Because we have the ONLY place in the world, where we have unconstrained port capacity and capabilities to move the product. So that's why we continue to see this having a lot of legs for some period of time, because as you look around the globe, (production) can go offline and down country by country out of the 12 to 13 major exporting countries, you will see everyone of them stuffed up with congestion, with probably the exception in United States. And the United States has the ability to move it, because they have the ability to BACKFILL it from somewhere else in the country. Otherwise, if we didn't have the PRB or the Illinois Basin to backfill, we will be doing what the other countries are doing, restricting exports.

* BTU CEO on International Producers Restricting Coal Exports: "I mean right now, China clearly has been at the top of the list. Their export license is going to be down from where people thought they were going to be this year. Vietnam has been restricting their exports particularly into the Chinese markets. Indonesia is now telling all of their domestic producers that they have got to supply their internal needs first, ahead of their ability to export, one of reasons why we have seen Indonesia basically flat year-over-year in terms of growth. South Africa is severely short of coal. I mean that's just came out with an estimate that they think they have got over the next five years or more. I guess it was 2017 where they need another 100 million tons of coal developed and they are 40-45 million tons short on their stockpiles, so where they are liken to be today. And Russia now is a country that in a major way is starting to restrict not only metallurgical coal but thermal coal, as they continue to build new generation, so that they can free up gas for exports on the gas. So that's kind of some of the major producing countries that have been traditional export countries over the last four, five years."


Full Disclosure: I own shares of BTU.

Tuesday, July 15, 2008

ALUMINUM - Abundant + Energy Expen$ive

Despite being the world's most abundantly available metal, ALUMINUM is the MOST-Energy Intensive to produce. Aluminum makes up about 8% of the Earth's solid surface weight and is the 3rd most abundant of all elements, behind oxygen and silicon. However, because of its strong affinity to oxygen, it is almost never found in the elemental state; instead it is found in oxides or silicates.

According to Wikipedia, Electric Power represents about 20% to 40% of the total cost of producing aluminium, depending on the location of the smelter. As a result, Aluminum Smelters tend to be situated where electric power is both plentiful and inexpensive, such as: South Africa, the South Island of New Zealand, Australia, China, the Middle East, Russia, Quebec, Canada and Iceland.

According to Bloomberg, the energy used by China's aluminum smelters each week is enough to provide electricity for more than 2 million people for a year.

----------------------------------------------------------------------

The Chinese Are Cutting (and Prices are Rising) :

* According to the British Geological Survey, China was the World's Largest Producer of Aluminium in 2005 with almost 20% world market share..followed by Russia, Canada and the U.S.

* China's largest aluminum smelters agreed on 7/10/08 to cut output by as much as 10%

* As a result of China's recently announced production cut, the research arm of Goldman Sachs (GS) cut their 2008 forecast expectations for a global aluminum surplus of 275,000 tons this year to 62,000 tons because of power shortages in China and South Africa...Because of a tightening supply environment Goldman Sachs also RAISED its 2008-2010 Aluminum Price Forecasts:

- Raised 2008: From $1.30 to $1.39 a pound (+7%)
- Raised 2009: From $1.32 to $1.60 a pound (+21%)
- Raised 2010: From $1.25 5o $1.45 a pound (+16%)


* Goldman Sachs also believes Chinese aluminum demand will rise 20% in 2009 and 15% in 2010, resulting in deficits (of supply)

bloomberg.com/apps/news?pid=20601087&sid=aHuHv.qdqDTY&refer=home

Data Courtesy: Bloomberg + Wikipedia
Full Disclosure: I own shares of GS.

Saturday, July 5, 2008

CAT's Doubling Up In China

According to Caterpillar (CAT) Vice President Thomas Bluth, CAT's sales in CHINA will double by 2010 from $2 Billion this year to $4 Billion.


uk.reuters.com/article/ousiv/idUKPEK26979520080704


Quick Points from the link above:

* Caterpillar is spending $1 billion in emerging markets over the next three years. More than half of that was earmarked for China, whose economy has grown by 10% or more for the past five years

* CAT's Asia Pacific (AP) revenues rose 37% in the first quarter from a year earlier and are expected to be up at least 15-20% for the year as a whole

* According to Bluth, the rising cost in global markets of commodities such as iron ore and steel has posed a big challenge for Caterpillar, which raised prices by 5% for all its products on July 1, 2008...."We are in the process of working to mitigate the impact in terms of passing on the cost," Bluth said. "But with the amount of increases, you can only offset a portion."...He said Caterpillar would keep examining whether it needed to raise prices further.

* One of CAT's toughest tasks is simply keeping up with the pace of business in the world's fastest-growing major economy..."To me, the biggest challenge is there's so much going on," Bluth said. "We see the market continue to grow significantly in terms of even smaller-sized excavators."...this week CAT announced plans to build a new plant in the eastern city of Nanjing to make small hydraulic excavators

* Caterpillar currently employs nearly 7,000 people in China in 16 businesses

Data Courtesy: Reuters
Full Disclosure: I own shares of CAT.

Wednesday, July 2, 2008

BHP, RTP and RIO - The Iron Ore OligOpoly

According to Bloomberg, 3 companies control about 80% of the WORLD's seaborn (exported) IRON ORE marketshare.


These companies are (in order of marketshare):

1. Brazil's Vale (RIO...$163 Billion marketcap) - WORLD's LARGEST producer

2. England's Rio Tinto (RTP...$162 Billion mCap) and

3. Australia's BHP Billiton (BHP...$223 Billion marketcap)

FYI, Iron ore is an essential input/raw material for producing STEEL. According to Wikipedia, 98% of all mined iron ore is used to create steel.

--------------------------------------------------------------------------

Anecdotally, No wonder China and India (ArecelorMittal Steel - MT) are concerned about a potential merger between mining giants BHP and RTP...can you say PRICING POWER !!

Lastly, for lists of the World's Largest Steel Producers (countries + companies), please refer to my archived 4/05/08 posts titled 'REF - World's Largest Steel Producers' and 'REF - World's Largest Steel Producing Companies'.

bloomberg.com/apps/news?pid=conewsstory&refer=conews&tkr=MT:US&sid=akBEPNWVyi7o

Data Courtesy: Bloomberg + Wikipedia
Full Disclosure: I own shares of MT.+ Wikipedia

Tuesday, June 24, 2008

U.S. Coal Exports GEO BreakDown

2007 U.S. Coal Exports Geographic BreakDown :

*Total 2007 U.S. Exports - Up 19% from 2006

Exports To Country - % Change from 2006

1.) Europe: Up 30% to 27.1 million tons

Slovakia - Up 424%
Netherlands - Up 118% to 4.6 m tons
Croatia - Up 116%
France - Up 47% to 2.4 m tons
Germany - Up 41% to 2.3 m tons
United Kingdom - Up 31% to 3.4 m tons
Romania - Up 28%
Turkey - Up 18% to 1.5m tons
Sweden - Up 14%
Italy - Up 8% to 3.5 m tons
Belgium - Down 3% to 2.1 m tons
Portugal - Down 4%
Spain - Down 9% to 1.5m tons
Slovenia - Down 39%
Bulgaria - Down 42%
Finland - Down 60%
Denmark - Down 79%

2.) North America: Down 7% to 19.2 million tons
Canada - Down 8% to 18.4 million tons
Mexico - Down 4%

3.) South America: Up 46% to 7.2 million tons
Brazil - Up 44% to 6.5 million tons
Argentina - Down 14%

4.) Africa: Up 229% to 4.5 million tons
Morocco - Up 768% to 2.4 million tons
Egypt - Up 113% to 1.5 million tons
South Africa - Up 101%
Algeria - Up 45%
Other - Down 47%

5.) Asia: Down 40% to 1.2 million tons
Japan - Down 98%
South Korea - Down 61%
India - Down 17% to 0.883 million tons
Other - Up 90%


http://www.eia.doe.gov/cneaf/coal/quarterly/html/t7p01p1.html


------------------------------------------------------------------------------

The Obvious Observations:

* The U.S. exported a total of 59 million short tons of Coal in 2007...19% growth over 2006 !

* The U.S. does NOT currently export coal to China (and very little to Asia overall...probably has to do with the transportation costs)

* Europe is the U.S.'s largest international customer region + consumed 46% of all U.S. coal exports in 2007

* The U.S.'s largest export customer BY FAR is Canada (down 8% yoy)...Canada consumed 31% of all U.S. coal exports in 2007

* The U.S.'s 2nd largest export customer is Brazil...exports to Brazil increased by 44% year over year and totaled 11% of all U.S. coal exports

* Europe's growth is ACROSS THE BOARD + led by the larger players - Netherlands (+118%), UK (+31%), France (+47%), Germany (+41%), etc.

Data Courtesy: EIA

REF - BP's 2008 Statistical Energy Report

British Petroleum (BP) just recently released their annual WW Energy Report (aka the BP Statistical Review of World Energy, June 2008) and inside are some interesting charts + data related to the WW Reserves + Consumption trends of Crude Oil, Natural Gas, Coal, Nuclear, etc. If you're curious (and you probably should be because ENERGY is inve$tible) then check out the impressive Adobe file per the below link:

http://www.bp.com/productlanding.do?categoryId=6929&contentId=7044622


-----------------------------------------------------------------------------

*For reference's sake I'm including below a couple of the more interesting charts I found on page 42 of the report (Double-click the images for a much needed larger view...per the color key below, Grey = Coal...Blue = Hydroelectricity...Orange = Nuclear...Red = Natural Gas...Green= Crude Oil):


*A couple of notes/observations per the Above Charts + Report:

A.) Ranking WW 2007 Consumption by Source (from most to least):

1. Crude Oil - 36%

2. Coal - 29%

3. Natural Gas - 24%

4. Hydroelectricity - 6%

5. Nuclear Energy - 5%

----------------------------------------------------------------

B.) REGIONAL Consumption by Source Breakdown:

* CRUDE OIL
accounted for: 51% of the Mid East's 2007 energy consumption...46% of South America's...40% of North America's...40% of Africa's...32% of Europe's and 31% of AP's 2007 energy consumption

* COAL accounted for: 50% of the Asia Pacific's 2007 energy consumption...31% of Africa's...22% of NA's...18% of Europe's...4% of SA's and 1% of the Mid East's 2007 energy consumption

* NATURAL GAS
accounted for: 47% of the Mid East's 2007 energy consumption...35% of Europe's...26% of NA's...22% of SA's...22% of Africa's and 11% of AP's 2007 energy consumption

* NUCLEAR
accounted for: 9% of Europe's 2007 energy consumption...8% of NA's...3% of AP's...0.8% of SA's...0.8% of Africa's and 0% of the Mid East's 2007 energy consumption

* HYDROELECTRICITY
accounted for: 28% of SA's 2007 energy consumption...6% of Europe's...6% of Africa's...5% of NA's...5% of AP's and 0.9% of the Mid East's 2007 energy consumption

-------------------------------------------------------------------------------

C.) B.R.I.C, U.S. + Canada Consumption by Source
:

BRAZIL
: 45% Oil, 39% Hydro, 9% NGas, 6% Coal and 1% Nuclear

RUSSIA
: 57% NGas, 18% Oil, 14% Coal, 6% Hydro and 5% Nuclear

INDIA
: 51% Coal, 32% Oil, 9% NGas, 7% Hydro and 1% Nuclear

CHINA
: 70% Coal, 20% Oil, 6% Hydro, 3% NGas and 1% Nuclear

UNITED STATES
:
40% Oil, 25% NGas, 24% Coal, 8% Nuclear and 3% Hydro

CANADA
: 32% Oil, 26% Hydro, 26% NGas, 9% Coal, and 7% Nuclear

--------------------------------------------------------------------------------

D.) Other Misc. Regional notes
:


- The Asia Pacific region consumes much more coal than anyone else (by far)...about 50% of AP's total 2007 energy consumption was coal (as noted above, India = 51% and CHINA = 70% COAL!)

- Europe consumes more nuclear energy than anyone else...about 9% of Europe's total 2007 energy consumption was nuclear (North America runs a close second with 8%)

- Relative to their total energy consumption, South America consumes much more hydroelectric power than anyone else...about 28% of SA's total 2007 energy consumption was hydro power (mostly Brazil as 39% of Brazil's total 2007 energy consumption was hydroelectricity)

- The Middle East is almost exclusively reliant on Oil and Gas (surprise, surprise) with both fuels accounting for a total of 98% of the Mid East's energy needs in 2007

Data Courtesy: BP Statistical Review of World Energy, June 2008

Friday, June 20, 2008

China's #1 Industrial Metal Consumption

According to a 6/20/08 CNBC interview with the CEO of Rio Tinto (RTP), Tom Albanese:

* CHINA is the World's Largest CONSUMER of Steel, Copper and Aluminum.

* Over the past 5 years, China has been responsible for 95% of the incremental growth in Copper consumption...Two years ago China was consuming 1/4 of the world's copper, now China is consuming 1/3 of the world's copper.

----------------------------------------------------------------------------
* United States-based Freeport Mcmoran Copper & Gold (FCX) is the world's largest publicly traded COPPER company...England-based Rio Tinto (RTP) is the world's largest publicly traded ALUMINUM company...Luxembourg-based ArcelorMittal (MT) is the world's largest publicly traded STEEL company.

Data Courtesy: CNBC
Full Disclosure: I own shares of FCX and MT.

Sunday, June 15, 2008

Rio Tinto's GEO + MINERAL Sales Breakdown

At a marketcap of approx $170 Billion, London, England-based Rio Tinto (RTP) is the world's 3rd largest publicly traded mining/minerals company, behind Australia's BHP Billiton (BHP) and Brazil's Vale (RIO).

Rio Tinto produces + sells a variety of minerals/commodities including: Aluminum (RTP is the world's largest supplier of Aluminum), Borates, Coal, Copper (RTP is the 4th largest supplier of copper in the world), Diamond (RTP is the 3rd largest supplier of diamonds in the world), Gold, Gypsum, Iron Ore (essential for steel production), Lead, Molybdenum, Nickel, Potash, Salt (RTP is the world's largest salt exporter), Silver, Sulphuric Acid, Talc, Titanium Dioxide, Uranium and Zinc.

--------------------------------------------------------------------------

* Rio Tinto's 1Q08 Sales Breakdown by GEO:
1.) North America --> 23%
2.) Europe --> 20%
3.) China --> 18%
4.) Japan --> 17%
5.) Other Asia, Australia, New Zealand --> 22%


--------------------------------------------------------------------------

* Rio Tinto's 1Q08 Sales Breakdown by Mineral:
1.) Irone Ore --> 26%
2.) Aluminum --> 21%
3.) Copper --> 16%
4.) Energy (Coal, Uranium, etc.) --> 13%
5.) All Others (Gold, Silver, Diamond, Molybdenum, etc.) --> 24%

-----------------------------------------------------------------------

FYI, Rio Tinto is currently engaged in 'hostile' takeover discussions with BHP Billiton.

http://www.bloomberg.com/apps/news?pid=20601109&sid=aSk0gUoU6nPo&refer=home

Data Courtesy: Bloomberg

Top 5 Carbon Dioxide Emitters

According to the Netherlands Environmental Assessment Agency, China is the World's Largest Carbon Dioxide emitting country and from 2006-2007, contributed to 2/3 of the world's 3.1% increase in CO2 emissions. The U.S. is the world's 2nd largest 'producer' of carbon dioxide and its emissions rose 1.8% from 2006 to 2007 vs. China's 8% yoy increase in emissions.

Top 5 + % of TOTAL GLOBAL Carbon Dioxide Emissions:
1. China -- 24%
2. U.S. -- 21%
3. E.U. (15 countries) -- 12%
4. India -- 8%
5. Russia --6%

------------------------------------------------------------------------
* Per the 6/13/08 NEAA press release (link is below):

"In 2007, global CO2 emissions increased by 3.1%, compared to 3.5% in 2006...With an 8% national increase, China’s carbon dioxide emissions accounted for two thirds of last year’s global carbon dioxide increase of 3.1%. India, the USA and Russia each contributed about 10% to the global increase. Since 1990, global CO2 emissions from fossil fuel use and cement production have increased by about 34%. The increase in global CO2 emissions was mainly due to the combustion of the fossil fuels coal, oil and natural gas. Fossil fuel still remains the most used energy source to meet the growing energy demand...China’s CO2 emissions are now estimated to be about 14% higher than those from the USA. With this, China tops the list of CO2 emitting countries, having about a quarter share in global CO2 emissions (24%), followed by the USA (21%), the EU-15 (12%), India (8%) and the Russian Federation (6%). Together, they comprise 71% of the total of global CO2 emissions. These figures are based on a preliminary estimate by the Netherlands Environmental Assessment Agency (PBL), using recently published BP (British Petroleum) energy data and cement production data for 2007.

* In 2007, global emissions of the main greenhouse gas carbon dioxide (CO2) from fossil fuel combustion increased by about 3.2%, which is about the same as the 3.1% increase in 2006. The increase in 2007 is mainly due to a 4.5% increase in COAL consumption:

- Global CO2 emissions from coal combustion increased by 4.5%. China contributed most to this increase with an 8% increase in 2007 (vs 12% in 2006). In the rest of the world coal combustion emissions increased by 2.2%.

- Global CO2 emissions from combustion of natural gas increased by 3.1%, mainly due to increasing consumption in China, Russia, Japan and Turkey.

- Global CO2 emissions from combustion of oil products increased by only 1.1%, mainly due to a decrease in consumption in OECD countries of 0.9%, on average. In non-OECD countries, oil consumption increased in 2007 by 3.8%. China, India, Saudi Arabia and Brazil contributed most to this increase.

Total CO2 emissions from fossil fuel combustion in China increased in 2007 by 7.6%. CO2 emissions from fuel combustion in the European Union countries “EU-15” decreased by 1.9% in 2007; in 2006 the emissions remained almost constant."

http://www.mnp.nl/en/index.html

Data Courtesy: NEAA

Monday, June 9, 2008

Apple's 3G iPhone + Jobs Keynote


In a widely anticipated move today, Apple CEO Steve Jobs announced the company's 2nd generation iPHONE during a developer's conference in San Francisco (link to a video of the Keynote is at the bottom of this post). According to Macrumors.com, here's a Quick look at some of the DETAILS of APPLE's (AAPL) New 3G iPhone:

http://www.macrumorslive.com/

* Availability --> The 3G iPhone will be available beginning July 11th, 2008 in 22 countries...While the first iPhone was sold in only 6 countries, Apple expects to roll out the new 3G iPhone in over 70 !

* Price --> The 8 GB 3G iPhone version will sell for $199...the 16 GB version will cost $299...For the unlimited data plan the iPhone will cost about $70/month.

* Battery Life --> 300 hours of standby...2G talk-time now has 10 hours (as opposed to 5)...5 hours of 3G talk-time (most phones only have 3 hour 3G talk time)...5 to 6 hours of high-speed Internet browsing...7 hours of video...24 hours of audio.


* Internet --> Comparing download speeds between 3G and EDGE (the first iPhone's data network), 3G finished in 21 seconds vs. EDGE which finished in 59 seconds....the 3G Iphone's download speeds are 2.8X faster + approaching WiFi speeds (WiFi scored 17 seconds)...When compared to other 3G phone peers (Nokia N95 and Treo 750), the iPhone is 36% faster.


* Enterprise --> Complete support for Microsoft Office applications (Word, Excel, and now PowerPoint)...Offers business email access to the Microsoft Exchange server (Microsoft Outlook)...Businesses can now also create + distribute specific iPhone apps to their employees. They authorize iPhones within their enterprise and then create applications that just run on those phones. The apps can then be distributed through their Intranet.

* GPS --> will now be integrated into the iPhone (sorry Garmin/GRMN)

----------------------------------------------------------------
*Other interesting Keynote details:

- In Apple's joint 3rd party software development kit (SDK) model for the iPhone, Apple receives 30% of TOTAL 3rd Party Application sales (the 3rd party software developers keep 70% of total app revenue)

- In Apple's SDK model, the 3rd party developers determine the price on apps/software sold for the iPhone

- In the U.S., Apple's wireless partner, AT&T Inc. (T), will be subsidizing the new iPhone and requiring buyers to sign a two-year service contract. Gene Munster, an analyst at Piper Jaffray, estimated that AT&T might be paying Apple as much as $499 per iPhone, though Apple and AT&T declined to disclose the actual number

- Currently the iPhone is sold in only 6 countries...Apple plans to expand the Roll Out of its New 3G iPhone to 70 countries over the next several months including:

* 15 countries in South + Central America: Argentina, Brazil, Chile, Columbia, Dominican Republic, Ecuador, El Salvador, Guatemala, Honduras, Jamaica, Mexico, Nicaragua, Paraguay, Peru and Uruguay

* 29 countries in Europe: UK, Ireland, France, Germany, Austria, Belgium, Croatia, Czech Republic, Denmark, Estonia, Finland, Greece, Hungary, Italy, Latvia, Liechtenstein, Lithuania, Malta, Netherlands, Norway, Poland, Portugal, Qatar, Romania, Slovakia, Spain, Sweden, Switzerland and Turkey

* 8 countries in Asia + Australia: Australia, Hong Kong, India, Japan, Macau, New Zealand, Philippines and Singapore

* 3 countries in North America: Canada, Mexico and the United States

...While India, Brazil and Japan are on the list I should note that I did not see China or Russia included as iPhone markets in Apple's presentation

-----------------------------------------------------------------

*Lastly, check out the below Apple.com link to view video of the Steve Jobs 3G iPhone + SDK (software development kit) Keynote from today:

http://events.apple.com.edgesuite.net/0806wdt546x/event/index.html

Data Courtesy: MacRumors.com
Full Disclosure: I own shares of AAPL.