The U.S. Department of Agriculture's (USDA) Annual March plantings Report was released on Monday, 3/31/08. According to Marketwatch.com, "The government's report on planting intentions by U.S. farmers is a closely watched indicator for how much grain the U.S. -- the largest exporter of many grains -- will supply. The information affects exchange prices and the bottom lines of ethanol makers, fertilizer manufacturers, hog farms and corn sweetener producers."
http://www.cnbc.com/id/23879013
My Main Takeways:
*CORN acreage is expected to FALL to 86 million acres this year, down 8 percent from last year's ethanol-fueled record (this seems bullish for higher corn prices relative to prior supply expectations)
*SOYBEANS are expected to hit 74.8 million acres, an 18 percent increase (this seems bearish for higher soybean prices relative to prior supply expectations)
*WHEAT plantings are expected to increase 6% to 63.8 million acres
*COTTON plantings will decrease 13% to 9.4 million acres (not sure of the ramifications here but 13% seems like a pretty hefty supply reduction)
Report CAVEAT --> "The Agriculture Department numbers only express intentions and are still subject to change depending on a variety of factors, particularly rain, which would be hardest on corn as it is the most weather-sensitive crop. A wet spring could lower corn yields, causing prices to surge."
Data Courtesy: CNBC.
Monday, March 31, 2008
Gamestop In Norway + 30 Days Til GTA4 !
Gamestop (GME) just announced that they bought an additional 49 store locations in Norway...further diversifying their revenue + earnings base away from the U.S:
http://www.forbes.com/feeds/ap/2008/03/31/ap4832933.html
From the article:
*GME is buying an additional 49 Free Norway Record Shops and then converting them into Gamestop video game outlets
*The deal is expected to be completed in early April
*After the stores are added, GameStop will run 160 locations throughout Norway, Sweden, Denmark and Finland (per Google Finance, as of February 2007, GME operated 4,778 stores WW)
----------------------------------------------------------------------------
*Lastly...note to SELF...we are only 30 DAYS AWAY (4/29/08) from Take Two's (TTWO) BLOCKBUSTER launch OF potential VIDEO GAME OF THE YEAR, GTA 4...should be a positive catalyst for GME shares. Check out the impressive GTA 4 HYPE at:
http://www.rockstargames.com/IV/
Data Courtesy: Forbes.
Full Disclosure: I currently own shares of GME.
GRAPHS - Global Oil Prices + Inventories
For some perspective on crude oil supply, check out the link below to an interesting GRAPH by the IEA (International Energy Agency) showing the change in Days of Global Oil Inventory (WW SUPPLY) since January 2004.
It's interesting to see that even though OIL prices have been in a steep uptrend since 2004, oil inventories have remained relatively FLAT worldwide. More specifically, while oil prices have increased 225% since January 2004 ($30.81/barrel!), days of global inventory/supply have only increased 4% (an increase of about 2 days worth of supplies to the market)!
The million dollar question should now be, WHY isn't new SUPPLY FLOODING the market when oil prices are over 200% higher than they were 4 years ago?? In a perfect world and per the economic textbooks we read in high school, oil producers should be doing all they can to churn out more supply and meet market demand at the VERY PROFITABLE $100/barrel level. I believe this graphs adds validity to the argument that higher energy prices are in the cards because crude oil is a long term supply problem (price activity is being driven by SCARCITY). Anyways, who knows why oil supply is currently constrained (...MAYBE the producers + OPEC are manipulating supply numbers and production activities to power the price higher? MAYBE its just huge demand from India and China...), BOTTOM LINE is that it looks like the long term trend in prices remains HIGHER until either WW demand DRAMATICALLY slows down or WW supply (as measured by the days of oil inventory) DRAMATICALLY increases.
As a long term energy investor I remain excited about the possibility of higher trending prices...as a lowly consumer though I'm a little bit worried about the ramifications..
*Graph on recent Oil Supply (Inventories):
http://images.thestreet.com/tsc/common/images/storyimages/033108_cod.gif

Data Courtesy: Wikipedia + TheStreet.com
It's interesting to see that even though OIL prices have been in a steep uptrend since 2004, oil inventories have remained relatively FLAT worldwide. More specifically, while oil prices have increased 225% since January 2004 ($30.81/barrel!), days of global inventory/supply have only increased 4% (an increase of about 2 days worth of supplies to the market)!
The million dollar question should now be, WHY isn't new SUPPLY FLOODING the market when oil prices are over 200% higher than they were 4 years ago?? In a perfect world and per the economic textbooks we read in high school, oil producers should be doing all they can to churn out more supply and meet market demand at the VERY PROFITABLE $100/barrel level. I believe this graphs adds validity to the argument that higher energy prices are in the cards because crude oil is a long term supply problem (price activity is being driven by SCARCITY). Anyways, who knows why oil supply is currently constrained (...MAYBE the producers + OPEC are manipulating supply numbers and production activities to power the price higher? MAYBE its just huge demand from India and China...), BOTTOM LINE is that it looks like the long term trend in prices remains HIGHER until either WW demand DRAMATICALLY slows down or WW supply (as measured by the days of oil inventory) DRAMATICALLY increases.
As a long term energy investor I remain excited about the possibility of higher trending prices...as a lowly consumer though I'm a little bit worried about the ramifications..
*Graph on recent Oil Supply (Inventories):
http://images.thestreet.com/tsc/common/images/storyimages/033108_cod.gif

*Graph on recent Oil Prices:
http://upload.wikimedia.org/wikipedia/en/a/ad/Oil_Prices_Medium_Term.jpg

http://upload.wikimedia.org/wikipedia/en/a/ad/Oil_Prices_Medium_Term.jpg

Data Courtesy: Wikipedia + TheStreet.com
Marcin's State Of The Market
I am a paid subscriber and loyal reader of financial news website, RealMoney.com. The below quote is from one of Realmoney's key contributors, Robert Marcin. In my opinion, Mr. Marcin's done a good job (thus far) of investing/trading and helping navigate readers through this U.S. credit crisis/recession...below he shares some valueable insight on what his current economic assumptions are and how he's trading them:
"I continue to avoid or short the domestic consumer and its financier. I would avoid home builders, banks, brokers, autos, general retail, consumer durables, utilities, and REITs. Here, falling home prices, a slowing domestic economy, shrinking balance sheets, and bigger financial charges will depress sales and profits for most companies.
While the world economy is slowing, the US housing/financial/durable economy is IMPLODING. I don't get the desire of investors to try to catch bottoms in a collapsing sector of the economy. This bottom fishing attempt in the housing/finance mess reminds me of the same after the tech bubble implosion. Everyone was too early.
My formula has always been to buy stocks that are down and cheap with good fundamentals, NOT imploding ones. I am watching the economic data very closely to see if we get a SPILLOVER of the problems (if the U.S.'s recession affects + materially slows down GLOBAL growth in the BRIC + ROW countries). But so far, the real, global economy has continued to muddle through the US housing/finance bust. If things change, I will adjust my positions. But for now, things still look ok with the global infrastructure/commodity/energy technology theme."
Data Courtesy: RealMoney.com (subscription), snagged on 3/31/08.
Saturday, March 29, 2008
Oil + Nat Gas Price RATIO Relationship ?
While I'm skeptical, there are investors out there who strongly believe in a historical RATIO relationship between the price of CRUDE OIL and NATURAL GAS. If you're interested and have some time then I recommend you to check out the below link to an interesting study done on the topic by a couple of Rice University PH.D's in 2007:
http://www.rice.edu/energy/publications/docs/natgas/ng_relationship-nov07.pdf
Net of the net, the study concludes, "Importantly, we conclude that U.S. natural gas and crude oil prices remain linked in their long term movement...One implication of this finding is that, if international crude oil prices remain high, U.S. natural gas prices are unlikely to collapse substantially over the long term. According to our analysis, a $70 per barrel WTI average price is likely to promote a long run equilibrium natural gas price at the Henry Hub of around $9.40 per MMBtu. Furthermore, our analysis also shows that factors such as weather shocks and changes in storage can lead to substantial deviations from this long run price ratio. "
According to this study, the approximate price relationship between oil and natural gas should be about 7.5 : 1 and would look like this:
Oil : Natural Gas
$60 : $8.00
$70 : $9.33
$80 : $10.67
$90 : $12.00
$100 : $13.33
$110 : $14.67
$120 : $16.00
*For some perspective, crude oil is currently trading at $105.62/barrell while natural gas is at $9.80/BTU. If you are to accept the study's price ratio relationship of 7.5:1 as Gospel then you could argue that in today's market EITHER:
1.) CRUDE OIL is historically over-priced by $30/barrel (35% DOWNside risk!)
OR
2.) NATURAL GAS is historically under-priced by about $5/BTU (representing 50% UPside to the current price of natural gas!)

Data Courtesy: Rice University.
WW 1Q08 M+A - Goldman's #1
Investment banker Goldman Sachs (GS) led all WW financial firms in Global Mergers + Acquisitions activity during the first quarter of 2008.
During 1Q08, the firm advised on 81 deals worth a total of $231.5 Billion. Per the article link below, it is estimated that Goldman collected an industry leading $400 million in fee revenues from this work.
Lehman Brothers (LEH) finished second in Global M+A having worked on $203 Billion worth of deals during the quarter. Citigroup (C) came in third with involvement in about $190 Billion worth of deals during the first 3 months of the year.
http://money.cnn.com/news/newsfeeds/articles/djf500/200803272016DOWJONESDJONLINE001170_FORTUNE5.htm
Data Courtesy: CNNMoney.com, snagged on 3/29/08.
Full Disclosure: I own shares of GS.
Friday, March 28, 2008
U.S. Natural Gas Usage
Breakdown of U.S. Natural Gas Usage + Demand Drivers:
U.S. Natural Gas Demand for 2005:
US Residential --> 4,838 (22%)
US Commercial -->3,057 (14%)
US Industrial --> 6,608 (30%)
US Electric Power --> 5,797 (26%)
US Other --> 1,650 (8%)
Total US Demand --> 21,950 (100%)
----------------------------------------------------------------------------------------------------
The DEMAND for Natural Gas is mainly driven by the following factors:
- Weather
- Demographics
- Economic Growth
- Fuel Competition
- Storage
- Exports
*Natural gas demand can be seasonal + often fluctuates with THE WEATHER. Usually the demand for natural gas peaks during the colder months of the year (November-March)...if the summer season is extremely hot, it can also result in greater cooling demands, which in turn may also result in increased summer demand for natural gas.
*Changing demographics also affects the demand for natural gas, especially for core residential customers. In the US for instance, recent demographic trends indicate an increased population movement to the Southern and Western states. These areas are generally characterized by warmer weather, thus we could expect a decrease in demand for heating in the winter, but an increase in demand for cooling in the summer.
*Natural gas storage levels have a significant impact on the commodity’s price. When the storage levels are low, a signal is being sent to the market indicating that there is a smaller supply cushion and prices will be rising. On the other hand, when storage levels are high, this sends a signal to the market that there is greater supply flexibility and prices will tend to drop.
*Check out the following GRAPH demonstrating the above-mentioned correlation between natural gas prices vs. natural gas storage levels (its a shame the graph only goes back to 2000)...there seems to be a definite inverse relationship between the two...the "high storage + high price" combination in late 2005 can be attributed to Hurricanes Katrina and Rita which materially disrupted Gulf Cost production and SPIKED prices...lastly, for reference's sake, the price of natural gas today is $9.80/BTU):
http://upload.wikimedia.org/wikipedia/en/3/35/UndergroundGasStorage_9.JPG

Data Courtesy: Wikipedia.com, snagged on 3/28/08.
REF - World's Largest Natural Gas Reserves
The World's Largest PROVEN Natural Gas Reserves (according to the 2007 CIA World Factbook):
Country: Reserves / Date of Info:
*WORLD: 165,843.265 / 2003 est.
1 Russia: 47,570 / 2003 est.
2 Iran: 26,620 / 2001 est
3 Qatar: 25,770 / 2004 est.
4 U.A.E.: 6,006 / 2003 est.
5 United States: 5,451 / 2003 est.
6 Nigeria: 4,984 / 2003 est.
7 Algeria: 4,545 / 2003 est.
8 Venezuela: 4,276 / 2003 est.
9 Iraq: 3,115 / 2003 est.
10 Indonesia: 2,760 / 2004 est
11 China: 2,350 / 2003 est.
12 Malaysia: 2,124 / 2004 est.
13 Norway: 2,085 / 2003 est.
14 Turkmenistan: 2,010 / 2004 est
15 Uzbekistan: 1,875 / 2003 est.
16 Kazakhstan: 1,841 / 2003 est.
17 Netherlands: 1,756 / 2003 est.
18 Egypt: 1,657 / 2003 est.
19 Canada: 1,603 / 2003 est.
20 Kuwait: 1,572 / 2003 est.
*Estimates are in billions of barrels per day.
--------------------------------------------------------------------------
* Russia is #1 by a WIDE margin...holding approx 30% of the world's natural gas reserves (this is WHY I love COP's 20% stake in Lukoil) !
* The world's largest gas field by far is Qatar's offshore North Field, estimated to have 25 trillion cubic metres (900 trillion cubic feet) of gas in place.
* Natural gas burns CLEANER than other fossil fuels (including oil and coal) and produces less carbon dioxide per unit energy released. For an equivalent amount of heat, burning natural gas produces about 30% less carbon dioxide than burning oil and about 45% less than burning coal
* Natural gas SUPPLY is expected to peak around the year 2030, 20 years after the peak of oil. It is also projected that the world's supply of natural gas could be exhausted around the year 2085.
Data Courtesy: Wikipedia
Wednesday, March 26, 2008
REF - World's Largest Crude Oil Reserves
The World's Largest PROVEN Crude Oil Reseves (according to data from Oil & Gas Journal, January 2007):
Country / Reserves / Production / Reserve life (years)
1. Saudi Arabia / 260 / 8.8 / 81 (yrs)
2. Canada / 179 / 2.7 / 182
3. Iran / 136 / 3.7 / 101
4. Iraq / 115 / 2.2 / 143
5. Kuwait / 99 / 2.5 / 108
6. United Arab Emirates / 97 / 2.5 / 107
7. Venezuela / 80 / 2.4 / 91
8. Russia / 60 / 9.5 / 17
9. Libya / 41.5 / 1.8 / 63
10. Nigeria / 36.2 / 2.3 / 43
11. United States / 21 / 4.9 / 12
12. Mexico / 12 / 3.2 / 10
*Estimated reserves are in Billions of barrels
*Production rate is in millions of barrels per day
*Reserve life in years calculated as reserves / annual production

Data Courtesy: Wikipedia.com, snagged on 3/26/08.
Shopping At The $44 Trillion Market
I Didnt
Know
That
...The entire GLOBAL marketcapitalization for ALL stock markets is $43.6 TRILLION (as of March 2006).
Fact Courtesy: Wikipedia.com, snagged on 3/26/08.
Know
That
...The entire GLOBAL marketcapitalization for ALL stock markets is $43.6 TRILLION (as of March 2006).
Fact Courtesy: Wikipedia.com, snagged on 3/26/08.
REF - World's Largest Gold Reserves
The World's Largest holders of GOLD Reserves (the largest gold holdings as reported by the World Gold Council):
Country / 2005 Gold tonnes / 2007 Gold tonnes
1 United States of America / 8,133.5 / 8,133.5
2 Germany / 3,427.8 / 3,417.4
3 International Monetary Fund / 3,217.3 / 3,217.3
4 France / 2,892.6 / 2,622.3
5 Italy / 2,451.8 / 2,451.8
6 Switzerland / 1,290.1 / 1,166.3
7 Japan / 765.2 / 765.2
8 Netherlands / 722.4 / 624.5
9 European Central Bank / 719.9 / 604.7
10 People's Republic of China / 600.0 / 600.0
11 Republic of China (Taiwan) / 423.3 / 423.3
12 Portugal / 407.5 / 382.6
13 Russia / 386.6 / 438.2
14 India / 357.7 / 357.7
15 Venezuela / 357.4 / 356.8
16 United Kingdom / 311.3 / 310.3
17 Austria / 307.5 / 280.0
18 Lebanon / 286.8 / 286.8
19 Pakistan / 283.0 / 265.3
20 Belgium / 227.7 / 227.6
* The U.S.'s holdings of gold is worth about $261 Billion (as of March 2008 + assuming the price is $1000/ounce). Anecdotally...is it me or does that not seem to be that big of a number considering the U.S. government just passed a $160 Billion economic stimulus?
Data Courtesy: Wikipedia.com, snagged on 3/26/08.
REF - World's Largest Populations
Some perspective...according to Wikipedia.com, these are the WORLD's 15 MOST POPULOUS NATIONS (pop numbers accurate as of 2006):
1. China: 1.32 billion (about 19.84%)
2. India: 1.12 billion (about 16.95%)
3. United States: 300 million (about 4.6%)
4. Indonesia: 225 million (about 3.5%)
5. Brazil: 186 million (about 2.8%)
6. Pakistan: 165 million (about 2.5%)
7. Bangladesh: 147 million (about 2.3%)
8. Russia: 143 million (about 2.2%)
9. Nigeria: 135 million (about 2.1%)
10. Japan: 128 million (about 2.0%)
11. Mexico: 108 million (about 1.7%)
12. Philippines: 93 million (about 1.4%)
13. Vietnam: 84 million (about 1.3%)
14. Germany: 82 million (about 1.3%)
15. Egypt: 75 million (about 1.2%)
Related Stats:
*Roughly 4.3 billion people live in these 15 countries, representing about 2/3 of the world's population.
*If added together, all of the countries in the European Union would have a population of 494 million people...about 7.3% of world's population in 2006...would be third in the list above (gives you a sense of how how much LEVERAGE an organized + disciplined EU could have in worldwide geopolitics).
*Asia accounts for over 60% of the world's population with almost 3.8 billion people (India + China ALONE make up 36% of the world's population).
*According to the CIA's 2006 World Fact Book, around 27% of the world's population is under 15 years old
Data Courtesy: Wikipedia.com, snagged on 3/26/08.
IDKT - ComScore Sample Size
I Didn't
Know
That
...Internet survey usage data provided by 'web measurement firm' ComScore (THE data used by so many investors to gauge + predict the earnings results of Internet Ad companies like Google, Microsoft, Baidu, Yahoo, etc.) is based on a worldwide sample size of (ONLY) 2 million users.
For some perspective, the entire U.S. population is about 305 million. The world's population? About 6.7 Billion. Both stats courtesy of Wikipedia.com.
Full Disclosure: I own shares of GOOG and BIDU.
RTOB: ECB, Commodities & The Dollar
Random
Thoughts
Of
Brilliance
Is the European Central Bank's (ECB) current reluctance to cut interest rates (and thereby indirectly provide support for a stronger Euro currency relative to the U.S. dollar) providing a floor/relative strong upside SUPPORT to U.S. dollar-denominated commodity prices (including crude oil, gold, steel, copper, etc.)?
Even DURING a U.S. recession, do commodity stocks remain FIRMLY in the 'buyable on a '15%+ dip' camp until the U.S. dollar STOPS sliding relative to the Euro??
Full Disclosure: Thinking out loud
FEARLESS FCX + The INEVITABLE
In light of Brazilian mining behemoth Vale (RIO...$170 Billion marketcap) ending its TAKEOVER talks with London-traded European mining company Xstrata (Xstrata's current marketcap is $35 Billion), who could be next on their list to ACQUIRE ?
http://www.bloomberg.com/apps/news?pid=20601081&sid=ahBpW.PXmMvw&refer=australia
I can't tell you for certain but I believe American made Freeport-McMoran Copper & Gold (FCX) is a very attractive takeover target. Sure it's a commodity stock and because of that its volatile movements can be difficult to STOMACH...BUT...as I mentioned in a previous post, this industry is rapidly + UNDOUBTEDLY undergoing 'consolidation' (acquisitions done in order to reduce/shrink the size of global players/sellers).
Couple of major reasons WHY global commodity players are consolidating:
1.) EXTERNAL GROWTH IS CHEAPER --> Because of current industry dynamics, it is actually cheaper for a lot of the MAJOR public commodity players (BHP Billiton, Vale, Rio Tinto, etc.) to outright buy smaller companies on 'wall street' vs. growing their businesses on 'main street' (i.e: taking the time to discover sites, gain regulatory approval, set up shop, explore, mine, etc.). In other words, 'external' growth is currently more attractive + cost efficient to these guys versus growing their businesses internally. Makes you think that a lot of the commodity stocks on wall street (many of which are selling at P/E's of 10-15) are INHERENTLY CHEAP, huh?? !
2.) GLOBAL SUPPLIER PRICE LEVERAGE --> Industry consolidation also offers the major players the opportunity to organize and incrementally gain global COMMODITY PRICING LEVERAGE against the HUGE + growing emerging market demand-side counter-parties (aka the usual suspects like India, China, Russia, etc.). As the demand base becomes larger these commodity companies are feeling the pressure to organize + consolidate in order to maintain pricing power.
The 'supplier/demander' war on commodities is very much REAL, ongoing and pretty darn interesting. For example, in an effort to block BHP from merging with RTP, CHINESE aluminum company, Chinalco, just recently teamed up with American aluminum company, Alcoa (AA), to acquire a 9% stake in BHP's potential takeover target Rio Tinto (RTP)! Why is that interesting? In MY opinion, China (the demand side) is clearly reacting to and feeling threatened by BHP's unsolicited RECORD $147 BILLION takeover bid for Rio Tinto. China is (and SHOULD be) concerned about doing its very best to STOP such a blockbuster merger from happening because it could very likely result in higher priced commodity imports for the country.
--------------------------------------------------------------------------------
Some FCX Stats:
*Marketcap: $37 Billion
*P/E: 12
*FORWARD 08 P/E: 14
*Dividend yield: 2%
*World's largest publicly traded copper company.
*2007 revs rose 190% yoy to $17 Billion (Phelps Dodge acquisition).
*2007 profits rose 93% yoy to $2.7 Billion.
*2007 Free Cash Flow rose 225% yoy to $6.2 Billion.
Full Disclosure: I own shares of FCX.
REF - MORTGAGE RATES (updated daily)
For my reference, the below link to http://www.myfico.com/ provides DAILY updated LENDING RATES for 30 year and 15 year FIXED MORTGAGES. Given the U.S. Fed + Treasury's recent aggressive actions I expect mortgage rates to FINALLY start to trickle down...which should eventually allow the masses to either refinance or buy new homes.

Data Courtesy: MyFico.com, snagged on 3/26/08.

Data Courtesy: MyFico.com, snagged on 3/26/08.
Tuesday, March 25, 2008
RTOB: How To Stop A Running DEERE ?
John Deere (DE), the $36 Billion public company known mostly for its international market-leading AGRICULTURAL equipment manufacturing unit, is up 56% over the past year and a JACKPOT 280% over the past five.
Got me thinking...in this time of UNPRECEDENTED growth (domestically and internationally), what, if anything, can STOP DE's RUN?
MAYBE it's the U.S. government's policy on foreign ethanol (Brazil is the world's largest producer and exporter of ethanol). To be more specific...DE could get slowed down if the U.S. federal government decided to REPEAL the import tariff on foreign-produced ethanol (currently $0.54 a gallon).
Why would the U.S. Government do such a thing? Because doing so could stimulate the economy by helping curb rising food prices (inflation) during already tough times for U.S. consumers. IF the Federal Reserve becomes sincere about curbing inflation then I believe there's a decent chance that this tariff gets THE BOOT. Maybe that's too forward-thinking for the current Bush administration...but if not them then there's still a decent chance this highly controversial tariff gets nixed by the NEW President in 2009.
As a result, if I sense the U.S. is EVEN close to repealing this tariff then I will immediately exit out of my DE position and give the stock some breathing room AND TIME to digest the news (might have some room to fall considering its up 300% in 5 years!).
----------------------------------------------------------------------
Some quick stats on DE:
*Marketcap: $36 Billion
*P/E: 19
*Forward 2008 P/E: 14
*2007 Sales: $24 Billion
*2007 Profits: $5.2 Billion
In Deere's latest reported quarter (Feb 13th), sales rose 18% while profits SPIKED 55% year over year. The company is also expecting a 17% increase in full year 2008 sales.
Full Disclosure: I own shares of DE.
Dan Fitzpatrick - Investing Advice
Some good investing advice courtesy of Dan Fitzpatrick, investor + contributor to subscription site Realmoney.com:
"Recognize that TRADING IS HARD...and the biggest reason it is hard is because we are 'hard wired'. We get greedy when we should be fearful; we get fearful when we should get greedy. We need to accept that the market will do what it will do. When a big fund decides to liquidate a stock that you hold a big position in, that stock will fall. But the inconvenient truth has nothing to do with global warming. The inconvenient truth is that the fund manager doesn't call you and give you a head's up about what he is doing. He just does it. How rude! So you just sit there and ponder the red on your screen. Analysts are the same -- they never give you advance notice that they are going to be changing their rating on a stock (at least, they don't give YOU advance notice -- but I sure can't say that as a universal truth. Remember, this is Wall Street). So you've got to do your own homework -- get a handle on the fundamentals of the company. Know what metric is the most important metric for the sector or group you are watching. Know your timeframe. Use charts and analysts' price targets to determine your potential reward and your probable risk. Know your trade. Plan your trade. And then trade your plan. Do that, and you won't be the guy who gets his lunch stolen by those who can afford to buy their own."
Data Courtesy: Realmoney.com, snagged on 3/25/08.
Monday, March 24, 2008
RTOB: Is GME a Best Buy?
Random
Thoughts
Of Brilliance
Could Best Buy (BBY), the country's premier consumer electronics superstore, one day be tempted to acquire dominant videogame retailer Gamestop (GME)?
I believe a deal would make great strategic sense for BBY (or ANY other similarly large + deep-pocketed retail company that doesn't mind spending for growth) given GME's dominant marketshare in the BOOMING video game consumer market. We've now just reached the beginning of the high margin $oftware phase of the 'video game upgrade cycle' as hardware (console) sales rose to $18 Billion in 2007 (up 43% over 2006!). Now that the next-gen console base has been built up retailers can sit back, relax + expect their margins to rise as sales on much higher-margined (more profitable) video game software titles start to account for a MUCH larger piece of the revenue pie. Best Buy's NOT stupid...they see the potential in this still emerging entertainment category. During their 3Q08 earnings conference call, Best Buy identified the video game category as a major growth focus area for the company. If Best Buy were to buy Gamestop then they could potentially become a one-stop paradise for video game enthusiasts looking for games, consoles, HD cables, surround audio and of course high definition televisions.
Regardless of the fundamentals though, I see this proposed combination facing some rather significant headwinds given a host of factors including:
1.) WEAK CREDIT MARKETS + FINANCING --> According to BBY's Dec 2007 quarter, the company exited the qtr holding about $1.3 Billion in cash. Given today's tight credit market environment, BBY would probably have a difficult time raising money + financing the rest of the deal.
2.) TIMING OF ACQUISITION --> On a P/E valuation basis Gamestop shares are almost 2 times more expensive than the average S+P 500 stock (mind you, this company is also growing MUCH faster than the average S+P 500 stock...on its investor relations site GME quotes its 5 year compounded annual EPS growth rate at 75%). Also, in terms of timing, this potential deal could be deemed as too risky for Best Buy considering Gamestop is trading at 'only' a 15% discount to its all-time highs of $64/share. Lastly, given the recessionary state of today's domestic economy, BBY could be 'playing conservative' when it comes to spending new capital on U.S.-focused growth (most of GME and BBY's retail locations are inside the U.S.).
3.) SIZE OF ACQUISITION --> On a markcap basis, GME is about 1/2 the size of Best Buy. Best Buy would be taking on a whole lot of risk onto their balance sheet if they were to go through with a takeover.
4.) BBY's INTERNATIONAL SITE DIVERSIFICATION FOCUS --> For the forseeable future, BBY is probably too busy + focused on its own strategic prerogative of diversifying its store count abroad (and away from the the U.S.) in countries like China, Canada, Mexico, Turkey, India, etc. Such an undertaking is probably a gigantic in scope and would leave little time + resources to give a takeover of GME a fair 'shake'/evaluation.
-----------------------------------------------------------------------
*For my own edification, here's a quick look at some interesting numbers:
P/E:
*BBY --> 14
*GME --> 38
FORWARD 2008 P/E:
*BBY --> 14
*GME --> 21
MarketCap:
*BBY --> $18 Billion
*GME --> $9 Billion
2007 Annual Sales:
*BBY --> $36 Billion
*GME --> $7.1 Billion
2007 Annual Profits:
*BBY --> $8.8 Billion
*GME --> $1.8 Billion
2007 Gross Profit Margin:
*BBY --> 24.4%
*GME --> 25.4%
Full Disclosure: I own shares of GME.
Bullish On Energy + COP
Some interesting investing notes about one of my favorite integrated oil plays, Conoco Phillips (COP). Data courtesy of Wikipedia.com + Conoco's very own Investor Relations link below:
*MATURE, CHEAP + NOT COMPLACENT --> COP is a MATURE $120 Billion market cap company + stock ($1000 invested in COP 20 years ago would be worth around $24,000 as of year end 2007) currently trading at a P/E of roughly 10 x earnings (and 9 x forward 2008 projected earnings). While the company's been around since the late 1800's, you should not confuse them with another larger and arguably lazier peer (Exxon Mobil...XOM's marketcap is currently $460 Billion). Unlike Exxon and some of the other larger oil companies, Conoco continues to actively invest a significant portion of its free cash flow enabled capital back into oil exploration + drilling. For example, during their March 12th Analyst Day, COP announced they would increase their 'new play' budget spend (capital allocated to newer, relatively unexplored geographic areas) in 2008 by 33% to $800 million.
*NATURAL GAS EXPOSURE --> COP is the 2nd largest U.S. natural gas producer (purchased Burlington Northern Resources in 2006 for $35.6 Billion). According to the Wall Street Journal, gas produces about 20% of the nation's electricity and heats about half of the country's homes.
*OIL REFINING LEADERSHIP --> COP is the 2nd largest U.S. oil refiner with 12 U.S. refineries combining to process a crude capacity of about 2.2M barrels per day. Worldwide, the company has a combined crude processing capacity of about 2.9 million barrels per day making it the 5th largest refiner IN THE WORLD.
*LARGE CANADA TARSANDS POSITION --> They are the largest U.S. energy company stakeholder of the Canadian Athabasca oil sand reserves + is targetting a long term annual production growth rate of 30%.
*LUKOIL STAKE --> Russia holds the world's largest reserves of natural gas and Lukoil is Russia's largest oil company and producer. The Strategic 20% ownership stake in Russian Lukoil accounted for 19% of Conoco's total 4Q07 oil + natural gas production (426 million barrels per day/2,261 million barrels per day) !
*CASH FLOW, BUYBACK + YIELD --> Per its analyst day on 3/12/08, COP is expecting itself to generate approx $28 Billion in free cash flow during 2008...they plan to use $10 Billion of this cash to repurchase its own shares (including dividends, COP plans to return a total of $13 Billion directly to shareholders). Currently COP sports a pretty attractive 2.5% dividend yield.
-------------------------------------------------------------------------------
Breakdown of Conoco's 4Q07 profits by business unit:
1.) Exploration + Production --> $2.6 Billion (60% of earnings)
2.) Refining + Marketing --> $1.1 Billion (25% of earnings)
3.) Lukoil, etc. --> $641 million (15% of earnings)
Breakdown of Conoco's 2008 E+P total oil + nat gas production OUTLOOK by geo:
1.) US --> 46%
2.) Middle East, Russia/Caspian, Africa, etc. --> 27%
3.) North Sea --> 18%
4.) Asia Pacific --> 9%
http://www.conocophillips.com/investor/financial_reports/index.htm
Data Courtesy: Wikipedia.com and COP Investor Relations, snagged on 3/24/08.
Full Disclosure: I own shares of COP.
Sunday, March 23, 2008
BAIDU, GOOGLE and the WW Online Ad Bull Market
According to the link at the end of this post, Sanford Bernstein analyst Jeffrey Lindsay is a believer in the following ONLINE ADVERTISING Bull market STATS:
*Online advertising is expected to grow by 23.9% in the U.S and 23.3% worldwide in 2008 (this compares to last year's growth of 25% in the U.S. and 26.3% WW).
*Only 8.5% of all WW advertising/marketing is now done online.
*ComSCORE reported that WW Internet searches were up 32% to 67 Billion in February.
*Google (GOOG), the clear #1 in world search, ended February with around 63% of the WW search market.
*BAIDU (BIDU) is earning almost 1/4 of ALL sales in China's online advertising market (Google ranks 4th in the country with 10% share of China's total online ad revenues).
http://www.pr-inside.com/google-yahoo-baidu-and-buzz-technologies-r495492.htm


Data Courtesy: PR-inside.com, snagged on 3/23/08.
Full Disclosure: I own shares of GOOG and BIDU.
*Online advertising is expected to grow by 23.9% in the U.S and 23.3% worldwide in 2008 (this compares to last year's growth of 25% in the U.S. and 26.3% WW).
*Only 8.5% of all WW advertising/marketing is now done online.
*ComSCORE reported that WW Internet searches were up 32% to 67 Billion in February.
*Google (GOOG), the clear #1 in world search, ended February with around 63% of the WW search market.
*BAIDU (BIDU) is earning almost 1/4 of ALL sales in China's online advertising market (Google ranks 4th in the country with 10% share of China's total online ad revenues).
http://www.pr-inside.com/google-yahoo-baidu-and-buzz-technologies-r495492.htm
--------------------------------------------------------------------------------


Data Courtesy: PR-inside.com, snagged on 3/23/08.
Full Disclosure: I own shares of GOOG and BIDU.
ICICI Bank - 'Don't Call It A Comeback' ?
Down 38% YTD and now at $36/share, I believe ICICI BANK (IBN) offers one of the most compelling 2-3 year risk/reward bets currently available in the stock market today.
Below is a link to a pretty well written article shedding some outsider insight on the current 'investability' of the stock:
http://www.marketwatch.com/news/story/fragile-sentiment-sinks-banks/story.aspx?guid=%7BD68D1D91%2D368B%2D4A23%2D8C72%2DE05C45CCFB30%7D
My Takeaways:
*Credit in India is growing at an over 20% annual rate(!)
*The recent amortization issue involving the joint venture with Prudential doesn't seem to be all that of a big deal (looks like just a simple difference in accounting assumptions between 2 very different companies)
*$200 million of the reported $265 million in mark to market losses have already been provisioned for by the company
*ICICI Bank (IBN) is 70% owned by foreigners
*The stock is down 38% YTD and 50% from its highs in January
*At $36/share, the stock is now trading at 1.7 x Book Value (yeah I know...the measure has lost some credibility recently...regardless, this is an INDIAN BANK)
Full Disclosure: I own shares of IBN !
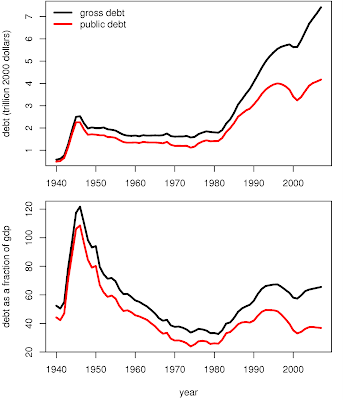
GRAPH - U.S. Debt % of GDP
U.S. PUBLIC DEBT (the public's burden of the government's debt) as a percentage of GDP is currently less than 40%. Per the graphs shown in the link below, looks like things will have to get a whole lot worse before we challenge the post World War II highs:
http://en.wikipedia.org/wiki/Image:USDebt.png
http://en.wikipedia.org/wiki/Image:USDebt.png

------------------------------------------------------------------------------
*For some perspective...According to the CIA World Factbook, note Country's X public debt % of GDP:
Japan --> 194%
Germany --> 65%
Canada --> 64%
India --> 59%
Brazil --> 44%
UK --> 43%
US --> 37%
Saudi Arabia --> 23%
China --> 19%
Australia --> 15%
Russia --> 7%
https://www.cia.gov/library/publications/the-world-factbook/rankorder/2186rank.html
Data Courtesy: Wikipedia.com + CIA World Factbook.
Equity Fund Inflows SPIKE UP $23 Billion
According to AMG Data Services, equity fund inflows increased by $23 Billion during the week of March 17th!
"Including ETF activity, Equity funds report net cash inflows totaling $22.937 billion in the week ended 3/19/08 with Domestic funds reporting net inflows of $24.197 billion and Non-domestic funds reporting net outflows of -$1.260 billion."
This week's data strikes me as an incredible number considering the trend (down) and size (small) of past AMG flows year to date (please see below). Mind you, we are still down $28.5 Billion in equity fund flows during 2008 BUT...it does seems to be a bit curious that this jump in equity fund flows would occur during the week of Bear Sterns' (BSC) epic collapse.
Are institutions slowly positioning themselves back into this market?
*Please note that there are only 3 examples of weekly equity fund inflows thus far in 2008...also please note the SIZE of those previous inflows.
Week of 3/17/08: $22.9 Billion (inflows)
Week of 3/12/08: $-1.4 Billion (outlows)
Week of 3/05/08: $-1.8 Billion (outflows)
Week of 2/27/08: $2.0 Billion (inflows)
Week of 2/20/08: $-4.2 Billion (outflows)
Week of 2/13/08: $-7.6 Billion (outflows)
Week of 2/06/08: $-7.9 Billion (outflows)
Week of 1/30/08: $-7.5 Billion (outflows)
Week of 1/23/08:$-13.6 Billion (outflows)
Week of 1/16/08: $7.3 Billion (inflows)
Week of 1/09/08: $-8.4 Billion (outflows)
Week of 1/02/08: $-8.3 Billion (outflows)
Data Courtesy: AMG Data Services: http://www.allstocks.com/markets/9amgdatext.htm
Jim Cramer's Take On The Uptick Rule
Jim Cramer is a strong believer in the SEC reversing its 2007 decision of doing away with the 'uptick' short-selling rule. For some perspective, according to Investopedia.com, the uptick rule was:
"A former rule established by the SEC that requires that every short sale transaction be entered at a price that is higher than the price of the previous trade. This rule was introduced in the Securities Exchange Act of 1934 as Rule 10a-1. The uptick rule prevents short sellers from adding to the downward momentum when the price of an asset is already experiencing sharp declines. The SEC eliminated the rule on July 6, 2007."
Cramer believes that putting the uptick rule back in place would benefit stocks by guarding them against the type of unfair, manipulative activity that quickly drove Bear Sterns (BSC) out of business last week.
" When hedge funds were $500 million they didn't have the power to destroy a stock. When they are $50 Billion they can take down anything, they're bigger than the (marketcap of) stocks. Merrill Lynch (MER) is to avoid (because of the activity that took down Bear Sterns) "
- Jim Cramer, via a 3/21/08 video interview on TheStreet.com (TSCM).
Data Courtesy: Investopedia.com + TheStreet.com.
Full Disclosure: I own shares of TSCM.
Saturday, March 22, 2008
GS 1Q08 Earnings Recap
GOLDMAN SACHS 1Q08 Earnings Report Stats:
Beat ?: YES (reported $3.23/share vs. analysts' consensus of $2.60/share)
Profit--> down 53% to $1.51 Billion (from $3.2 Billion)
Sales --> down 35% to $8.3 Billion (from $12.7 Billion)
Sales By Business Unit:
A.) Trading and Principle Investments: net revs of 5.12 billion (down 46% yoy)
*Fixed Income, Currency + Commodities (FICC): net revs of $3.14 Billion (down 32% yoy)
*Equities: net revs of $2.51 Billion (down 19% yoy)
B.) Asset Management + Securities Services: net revs of $2.04 Billion (up 28% yoy)
*Asset Management: net revs of $1.32 Billion (up 23% yoy)
*Securities Services: net revs of $722 million (up 38% yoy)
C.) Investment Banking: net revs of $1.17 Billion (down 32% yoy)
Other Highlights + Guidance:
*Marks the 11th straight quarter GS has exceeded analyst estimates
*Assets under Management increased 21% yoy to $873 Billion (net inflows of $29 Billion during the past qtr)...looks like GS may have picked up some marketshare from Bear
*Operating Expenses decreased 21% yoy to $6.19 Billion
*Book Value per common share = $92.44...TANGIBLE Book Value = $80.28/share
*GS wrote down about $1.0 Billion from losses on mortgage-related assets during the qtr
*GS's Return On Equity was 15% in 1Q08 (down from 38% in 1Q07)
*GS still currently holds about $20 Billion in mortgages ($12 Billion in prime, $5 Billion in Alt-A and $2 Billion in subprime mortgages)
*GS's LEVEL 3 ASSETS (the most difficult assets to value) rose from 7% of the firm's total assets in the prior qtr to 8%...gain was largely due to GS moving some commercial real estate loans from level 2 to 3
*Buyback --> GS bought back 7.9 million shares at an avg of $198.87/share (total cost of $1.56 Billion) over the past quarter...remaining share authorization for buyback is 63.5 million shares
"Our liquidity position now is stronger than it's ever been before...in my 9 years of being CFO we have never had a stronger liquidity position than we have now." - Goldman Saachs CFO, David Viniar (during the earnings conference call on 3/18/08 and AFTER the Fed opened up the discount window to brokers)
Full Disclosure: I currently own shares of GS.
Friday, March 21, 2008
SUBPRIME Slime - $195 BILLION And Counting
The world's biggest banks and securities firms have reported $195 billion in asset writedowns and credit losses since 2007 stemming from the collapse of the U.S. subprime mortgage market.

Data Courtesy: Bloomberg.com, snagged on 3/21/08.

Data Courtesy: Bloomberg.com, snagged on 3/21/08.
A 2H08 MARKET REBOUND ?
OK, upon careful contemplation this week, I now believe the market has a solid chance of bottoming and turning around during the 2nd half of 2008 based on the following assumptions/catalysts (please note, I still expect 2008 to be a net up/down single digit return year...as of today, 3/21/08, the S+P 500 index is down 10% year to date):
1.) SYSTEMIC RISK IS OFF THE TABLE --> Because of recent aggressive efforts by The U.S. Federal Reserve and U.S. Treasury department (including the Fed now allowing the investment banks to stave off short-term capital issues by borrowing at the discount rate), the issue of crisis/collapse for the financial markets is now finally OFF the table. In other words, fears of a DEPRESSION are no longer valid. Earlier this week, the U.S. government also finally 'unleashed' their government-sponsored entities (GSE's), Fannie Mae (FNM) and Freddie Mac (FRE), to expand their purchase of U.S. mortgages and related securities. According to OFHEO director, James Lockhart, the initiatives should immediately pump about $200 Billion into the mortgage-backed securities market. In fact, according to OFHEO, combined with a lifting of portfolio caps on March 1st, Fannie Mae and Freddie Mac should now be able to purchase or guarantee up to $2 TRILLION in mortgages this year.
2.) THE LAGGING EFFECT of RATE CUTS --> It has been historically observed that the U.S. Federal Reserve's interest rate cuts usually have a 6 month lagging effect in terms of stimulating the economy. The Fed cut rates by 125 basis points in January...this should not be felt by the economy until about July. Also, the Fed's recent cuts in March to 2.25% should provide further stimulus to the U.S economy + banking industry (those who benefit from borrowing at a cheaper rate + also by paying less interest to depositors) beginning roughly in September.
3.) $160 BILLION U.S. ECONOMIC STIMULUS PACKAGE --> While the economic benefits are largely psychological, the checks will officially be sent to U.S. households in May 2008. This should be a positive catalyst for RETAILERS + other Consumer Discretionary investments and will help them outperform against their pathetic 3Q07 sales figures. It's also important to remember that the stimulus package was designed with the purpose of improving the liquidity positions of the homebuilders + banks via its inclusion of significant tax-breaks to both beaten-up businesses.
4.) 2008 CHINESE SUMMER OLYMPICS (EMERGING MARKET CATALYST) --> The 2008 Summer Olympics begin in Beijing on August 8th, 2008. This should be a sizable catalyst for investing in China and other emerging markets in general AHEAD of August. The assumed success of the Olympics in China should serve as a GREAT reminder to worldwide investors about the REAL power + momentum of the B.R.I.C. story.
5.) U.S. FINANCIAL STOCK EARNING COMPARISONS --> U.S. financial stock earning comparisons should get easier beginning 3Q08 since 3Q07 was basically when the sub-prime mortgage sparked 'write-down' game began. If 3Q08 write-downs do not exceed the massive write-downs from 3Q07 then expect major U.S. financial stocks to stabilize. The keys will lie in the earnings + conference call stories delivered by the major institutions like Citigroup (C), Merrill Lynch (MER), Washington Mutual (WM) and Bank of America (BAC).
6.) TECH SECTOR SEASONALITY --> The technology stock sector historically underperforms the rest of the market in the spring and summer and typically bottoms in July-August. In other words, tech will become an investable sector again beginning mid 3Q08.
7.) PRESIDENTIAL ELECTION YEAR CALENDAR EFFECT --> Maybe I'm grabbing onto strings here but history shows that the average S+P 500 stock market return in the last year of a presidential term is about 10% (analyzed data is from 1950-2007). The data also determines that the 'best political quarter' is by far, November-January with avg S+P 500 returns of 4.8%. One important caveat to note though (that may make you immediately dismiss this data considering the context), is that the 'election year calendar effect' did not matter in 2007 (when the U.S. undoubtedly began its recession). According to the data from CXO Advisory, we should expect average returns of 18% in the 3rd year of a President's term...the S+P only gained 5.5% in 2007.
Thursday, March 20, 2008
Jim Rogers and the Million Dollar Commodities Question
Finally, the million dollar question answered by the billion dollar commodites man!
When should we worried about a TOP IN COMMODITIES??
JIM ROGERS, perhaps one of the most successful, well-known commodities traders of all time and author of Hot Commodities: How Anyone Can Invest Profitably in the World's Best Market (2004), has an answer courtesy his 3/19/08 interview with Bloomberg:
"If it's a 9th inning baseball game then we're in the 4th inning, we have a long way to go, Mr. Bernanke may make it last longer and longer...Mr. Bernanke has taken $400 Billion onto his balance sheet…There are over 70,000 mutual funds in the world for the public to invest in stocks and bonds...there are fewer than 50 for the public to invest in commodities ...nobody's buying this stuff yet...Yes it's up (but) wait until you have 5,000 or 10,000 mutual funds (then you might reach the top)!"
Wednesday, March 19, 2008
COMMODITIES - A Super Cycle or Just a WILD RIDE ?
Commodities can often be a WILD RIDE. So wild in fact that I wanted to opine on what I think are the current UPs, Downs and Unknowns to investing in commodity stocks...you decide if you think the risk is worth the potential reward$:
UPS - This is why you keep commodity stocks in your portfolio:
1.) GLOBAL FOOD SHORTAGE --> Food related commodity prices should continue to benefit in the long term as formerly 2nd and 3rd world nations continue to prosper and demand MORE food at a better quality.
2.) BRIC + REST OF WORLD GROWTH --> B.R.I.C. and other R.O.W countries continue to expand at an impressive yet healthy-looking, sustainable pace. According to the CIA's World Fact Book web site, China's growing its GDP at 10-11%, India and Russia are both growing around 7-8% and lastly, Brazil's bringing up the rear with ONLY 5-6% GDP growth. I will not back down from my strongly held belief that all 4 are still going through INDUSTRIAL REVOLUTIONS at the same time. For instance, Brazil is now energy independent and prospering on record high prices for commodities ranging from coffee to iron ore to orange juice to ethanol. Still, Russia is even more of an energy story, benefiting from holding the world's largest energy reserves (#1 in in natural gas reserves, #8 in crude oil reserves). The last two of the B.R.I.C. countries, India and China, both have GIGANTIC booming middle classes..arguably their greatest resources when engaging other nations in economic trade discussions.
3.) UNDENIABLE INDUSTRY CONSOLIDATION --> Probably the single-best reason to own commodity stocks today. Even if the short term's volatile, stomach the churn and I believe there's a better than not chance (if you pick your target right) that your company gets a takeover bid in the next 5-10 years. This industry is consolidating like MAD, witness some of the most recent examples:
1.) CVRD Vale (RIO) bought Inco - NICKEL
2.) Conoco Phillips (COP) bought Burlington Resources - NAT GAS
3.) Rio Tinto (RTP) bought Alcan - ALUMINUM
4.) Freeport-McMoran (FCX) bought Phelps Dodge - COPPER
5.-10.) Arcelor Mittal (MT) bought EVERYONE - STEEL
In fact, BHP Biliton recently offered to buy Rio Tinto for $147 Billion...if that deal is consumated it would be the LARGEST TAKEOVER EVER in any sector...YES, that's how much money is at stake in this sector.
Who's next to EVENTUALLY get aquired? I'd say it makes sense to bet on my favorite name, the $30 Billion Freeport-McMoran Copper + Gold (FCX). If copper's not your thing then there are other options like Alcoa (AA), Devon Energy (DVN), Cleveland-Cliffs (CLF), Reliance Steel (RS), etc.
4.) ULTRA CHEAP P/E's --> The average S+P 500 P/E multiple is 15. On a P/E basis, commodity and material stocks are one of the market's cheapest sectors. Exp's: FCX, COP and HAL all have P/E's of 10! RIO has a P/E of 12...BHP has a P/E of 14...Alcoa (AA) has a P/E of 12. Needless to say, even despite the recent bull run in commodities these stocks still appear cheap.
5.) HIGH YIELDS --> Commodity and material stocks are among the market's highest yielders. For example, BP yields a 5.5% dividend...COP yields 2.5%...PCU yields 6%...FCX yields 2%.
DOWNS - The downside of owning commodity stocks today:
1.) THE STOMACH CHURNING --> During the rough times it is important to remind yourself that by their very nature, commodities and commodity related stocks trade with much more VOLATILITY than the average stock. Violent moves up and down can take place daily because of the sheer amount of variables (and the various interpretation of how those variables impact the price) that exist and are involved in determining the commodity's value.
2.) DE-LEVERAGED TIMES --> Over the past year or two, commodity prices have been benefiting from LOTS of LEVERAGED 'speculative' INTEREST. Before getting scared realize that no one knows the ratio of buying vs. selling that these leveraged-up funds used. Maybe this speculative money's been shorting commodities? Anyways, in the wake of Bear's 30 X (L)everaged demise, expect wall street to unwind or be FORCED to unwind the LEVERAGE trade.
3.) HISTORICALLY HIGH PRICES --> Virtually all commodities are selling at historically high prices (although NOT record high prices when adjusted for inflation; i.e: gold and oil are not at record highs).
UNKNOWNS - Open questions the market is grappling with:
1.) GLOBAL RECESSION ? --> Will the U.S.'s recession spread to the rest of the world and become a global recession? Or will The Federal Reserve's recent liquidity measures prevent the U.S. from cooling down the BRIC + ROW global growth story? Expect commodity demand to drop (and prices to soften) significantly in the event of GLOBAL recession. Also, please remember that 'recession' implies a temporary or short-term decline...if your perspective is 3-5 years+ then this issue should not concern you...in the grand scheme of everything a recession will NOT mark the end of the global growth story).
2.) DIRECTION OF THE DOLLAR ? --> Commodities (including wheat, gold and oil) have been trading inverse to the dollar (while the dollar's been weakening commodities have shot through the roof)...after the Fed's latest move, is wall street now betting on a dollar reversal and therefore concluding we've seen some kind of a top in commodities? If so, a top for HOW LONG ? (1 month? 3 months? 1 year?).
Full Disclosure: I currently own shares of FCX, COP, DE and HAL.
Tuesday, March 18, 2008
GME 4Q07 Earnings Recap
GAMESTOP 4Q07 Earnings Report Stats:
Beat ?: YES (reported $1.14 after pre-announcing + raising guidance a month earlier)
Profit--> up 46% to $190 million (from $130 million)
Sales --> up 24% to $2.86 Billion (from $2.3 Billion)
Same Store Sales --> up 17%
Other Highlights + Guidance:
*GME expects 1Q08 same store sales to be up 24.5% driven by strong demand for new software titles (GTA 4, Super Smash Bros., Devil May Cry 4, etc.)
*GME expects entire fiscal 2008 revenue growth of 20% to $8.5 Billion w/ same store sales increasing 12% (better than current analyst consensus estimates)
*GME expects entire fiscal 2008 earnings of $2.30/share (vs. current consensus of $2.22/share)
*GME has a reputation for its conservative guidance (they are familiar with U.P.O.D.)
*GME is looking forward to the 2008 blockbuster software releases of Grand Theft Auto 4, Wii Fit, Metal Gear Solid 4, Gears of War 2, Mario Kart Wii, Gran Turismo 5, Ninja Gaiden 2, Star Wars: The Force Unleashed, Army of Two, World of Warcraft, Prototype, Ghostbusters, etc.
*GME cautioned that their 3Q08 this year will face a difficult comparison vs 3Q07 because of 2007's monster hit Halo 3...they expect their yoy growth to be the softest in 3Q08.
Full Disclosure: I currently own shares of GME.
Is Systemic Risk Finally OFF the Table ?
I think it may be but I'll let you decide:
*MONEY IS CHEAP --> After The Federal Reserve's latest 75 basis point cut, the cost of money is now HISTORICALLY low/CHEAP (the Fed Funds rate currently stands at 2.25%).
*THE FED + ITS MIGHTY BALANCE SHEET --> The Fed has FINALLY demonstrated it is now willing to use its $800 Billion balance sheet to fulfill its fabled role as the 'Lender of Last Resort'. By agreeing to buy $30 Billion of controversial bonds from Bear Sterns (as part of its de facto sale to JP Morgan), the Fed shows its serious about stemming this credit crisis.
*A BANKRUPTCY TEMPLATE --> Following the collapse of Bear Sterns (BSC), the country's 5th largest securities broker, a graceful/orderly bankruptcy TEMPLATE now exists (one that largely reduces financial counter party risk and thus, won't shock/crush the system)
*RELIEF FINANCING FOR BROKERS --> Brokers are now able to borrow at The Federal Reserve's discount rate (2.50%). How important is this you ask? Lehman wasted no time and on the first day the window was accessible (today), ran to it and tapped the Fed to the tune of $2 Billion. In fact, it is widely believed that Bear Sterns (BSC...or the artist formerly known as BSC) would be alive and liquid today had this option been available to them last week !
*COLLATERAL TOLERANCE + ACCEPTANCE --> The Fed is now willing to accept all investment-grade bonds as collateral for its loans. This is huge because it promotes greater liquidity in the system by allowing all of those brokers + banks previously STUCK with ugly CDO's AKA 'non-performing assets' to finally squeeze SOME good out of them. Maybe they'll no longer be ironically viewed as a liability. The Fed's willingness to accept all investment-grade bonds also helps out the credit rating agencies who rated several questionable assets (of all sorts of different types) as 'investment grade'.
*INVESTOR PSYCHOLOGY --> It is widely believed by many professional investors that the bottom of the 1998 bear market in stocks was triggered by the collapse of hedge fund Long-Term Capital Management. Is the Fed following a 1998 script that required it to be provoked by the failure of a major financial institution (today that would be Bear) in order to make an example out of them by citing that failure to the American people as an excuse to FINALLY GET ON THE BALL?
Subscribe to:
Posts (Atom)


